


Statistics
This section presents statistics on poverty, inequality, income and other socio-economic variables for all Latin American countries and several Caribbean included in the SEDLAC database.
Information taken from this database should be cited as “Source: SEDLAC (CEDLAS and The World Bank)” or “Source: Socio-Economic Database for Latin America and the Caribbean (CEDLAS and The World Bank).” We advise making reference to the date when the database was consulted, as statistics may change.
We would appreciate if a copy of publications or reports that use the information contained on this site is sent to us for our records to sedlac@cedlas.org
Latest update: January 2024
SEDLAC includes information from over 300 household surveys carried out in 24 LAC countries: Argentina, Bahamas, Belize, Bolivia, Brazil, Colombia, Costa Rica, Chile, Dominican Republic, Ecuador, El Salvador, Guatemala, Guyana, Haiti, Honduras, Jamaica, Mexico, Nicaragua, Panama, Paraguay, Peru, Suriname, Uruguay, and Venezuela.
For each period, the sample represents more than 97% of the total LAC population. The database covers the period 1974-2022, although in most countries the sample begins in the 1990s.
The following file includes a list of the household surveys that are used in the SEDLAC database and their main characteristics.
Updated: January 2024
The following files contain information on:
1. Detail on how incomes are constructed from household surveys.
2. Estimations of household per capita income by deciles, areas, and subnational regions.
Updated: January 2024
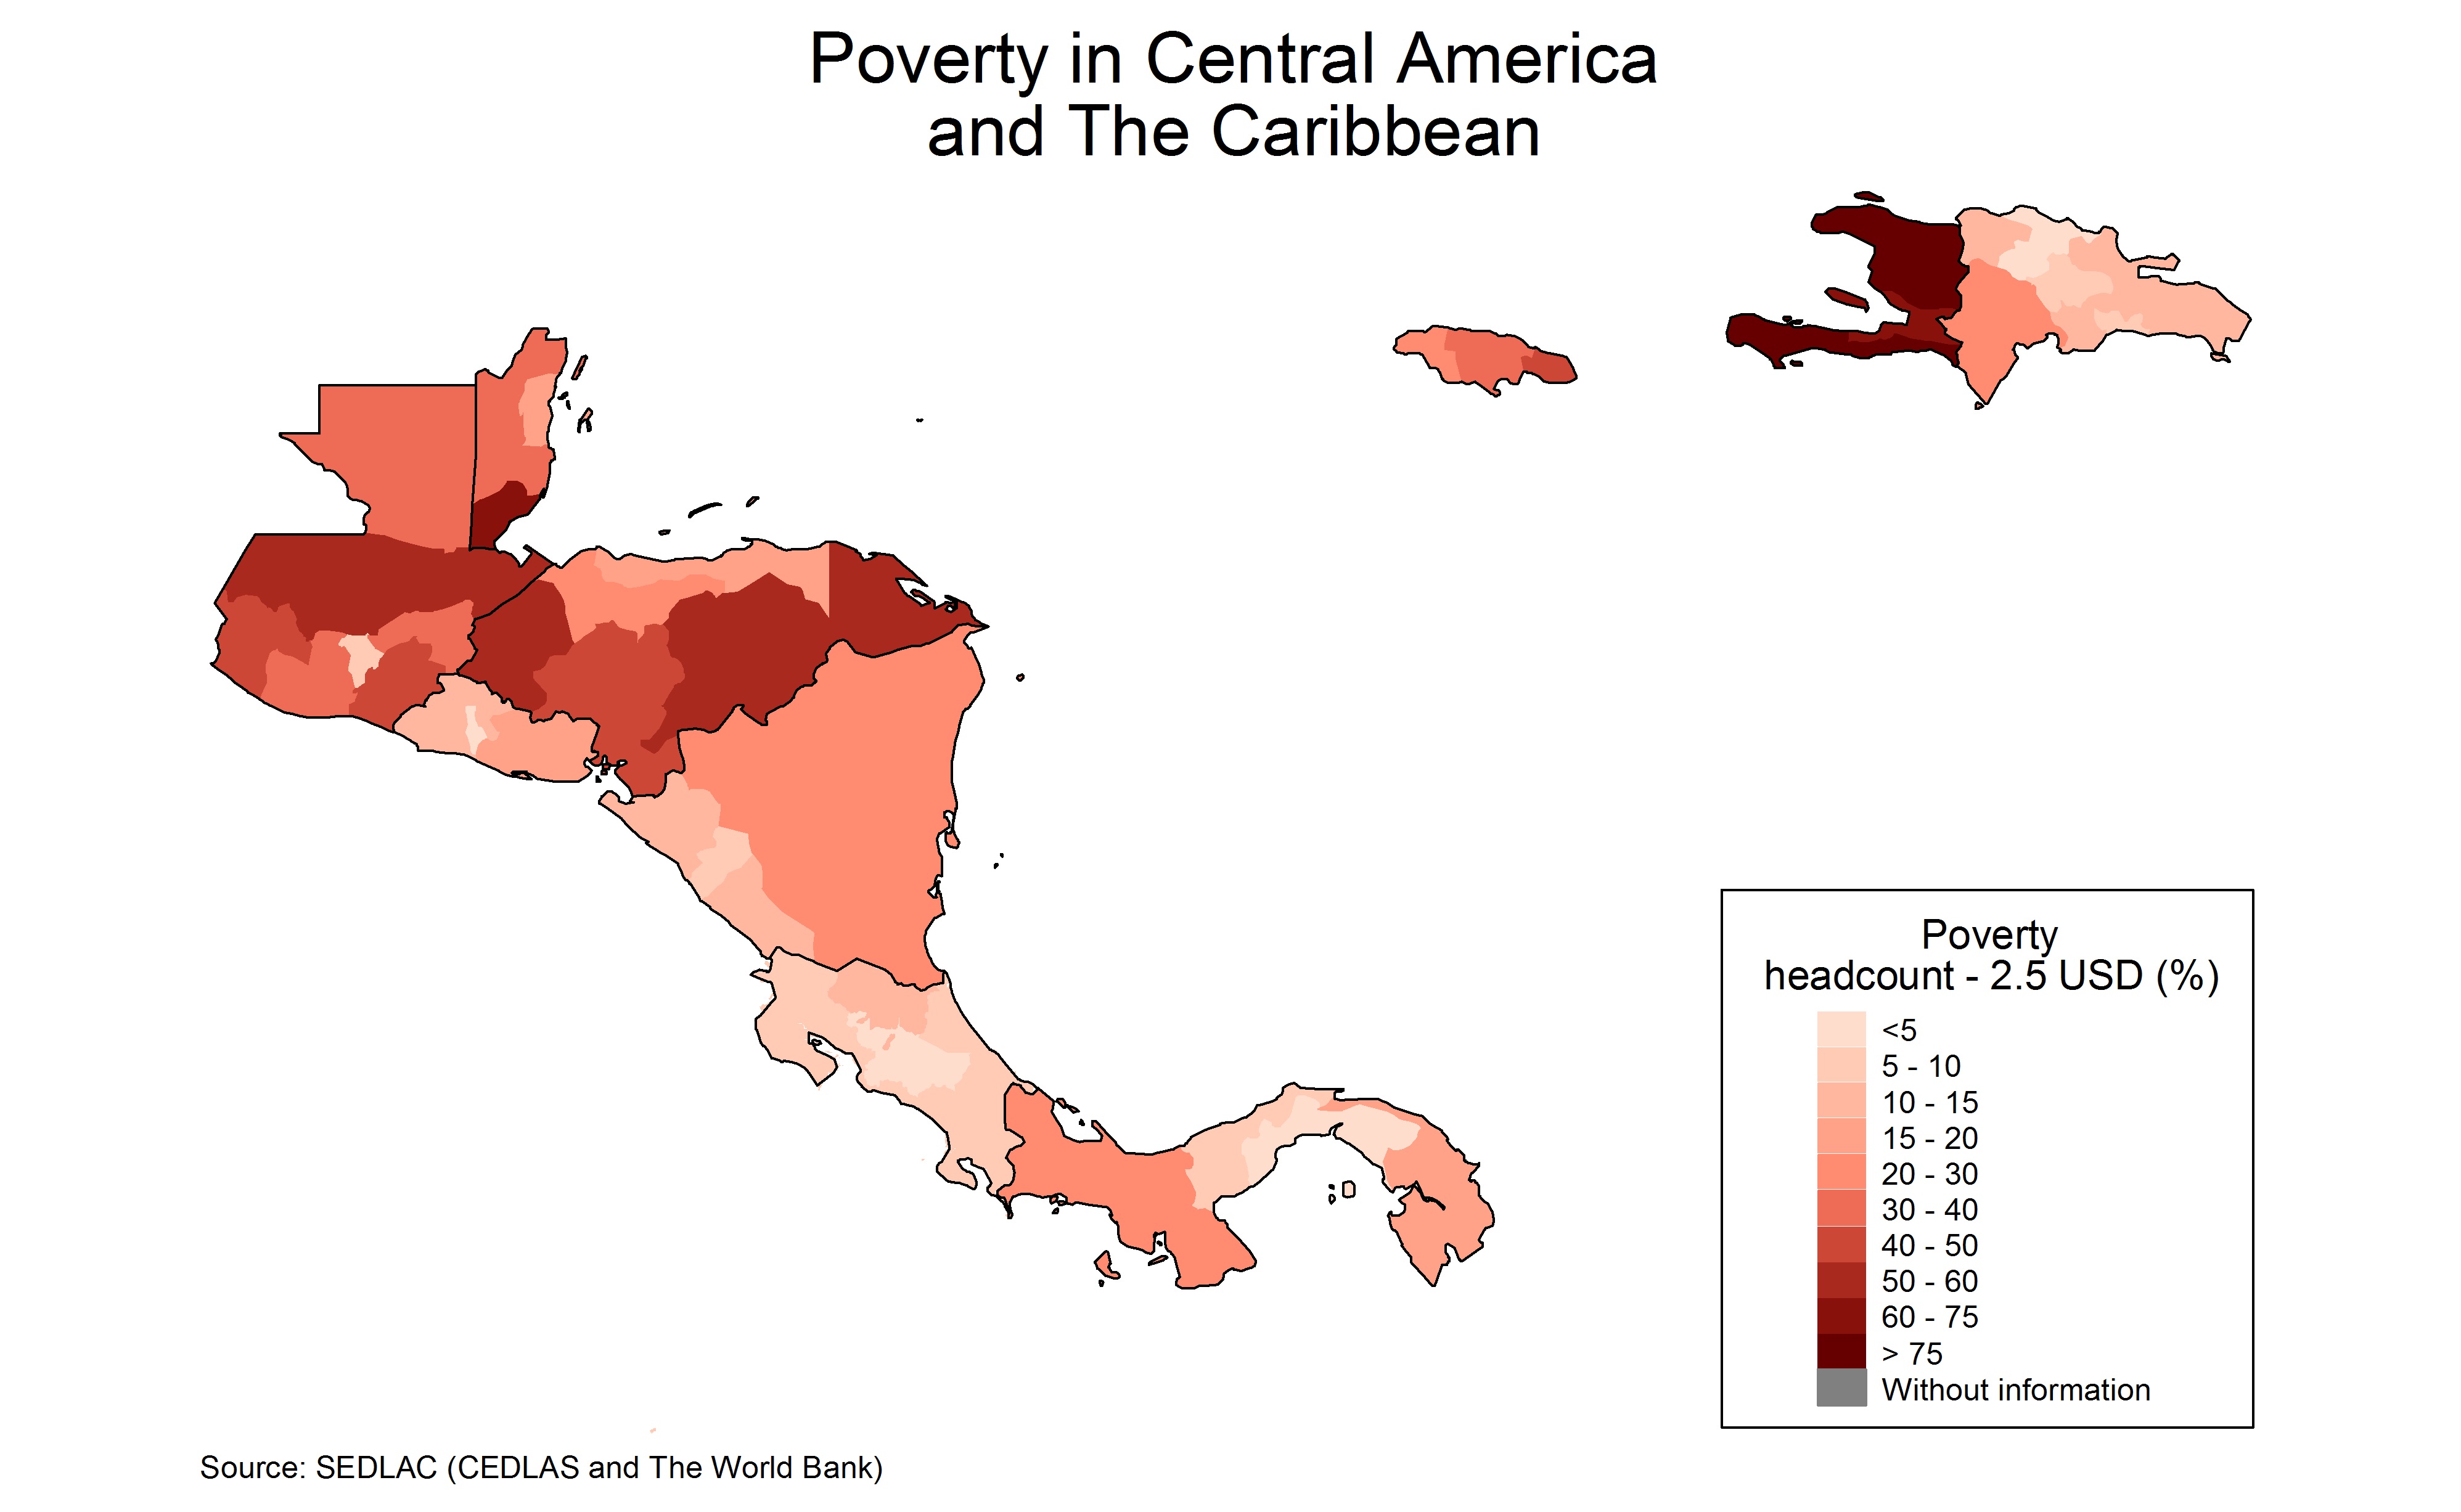
The following file contains several poverty indicators computed using CEDLAS methodology and international poverty lines: 2.15, 3.65 and 6.85 dollars a day at 2017 PPP. See the Methodological Guide for details.
Updated: January 2024
The Excel file contains the following information:
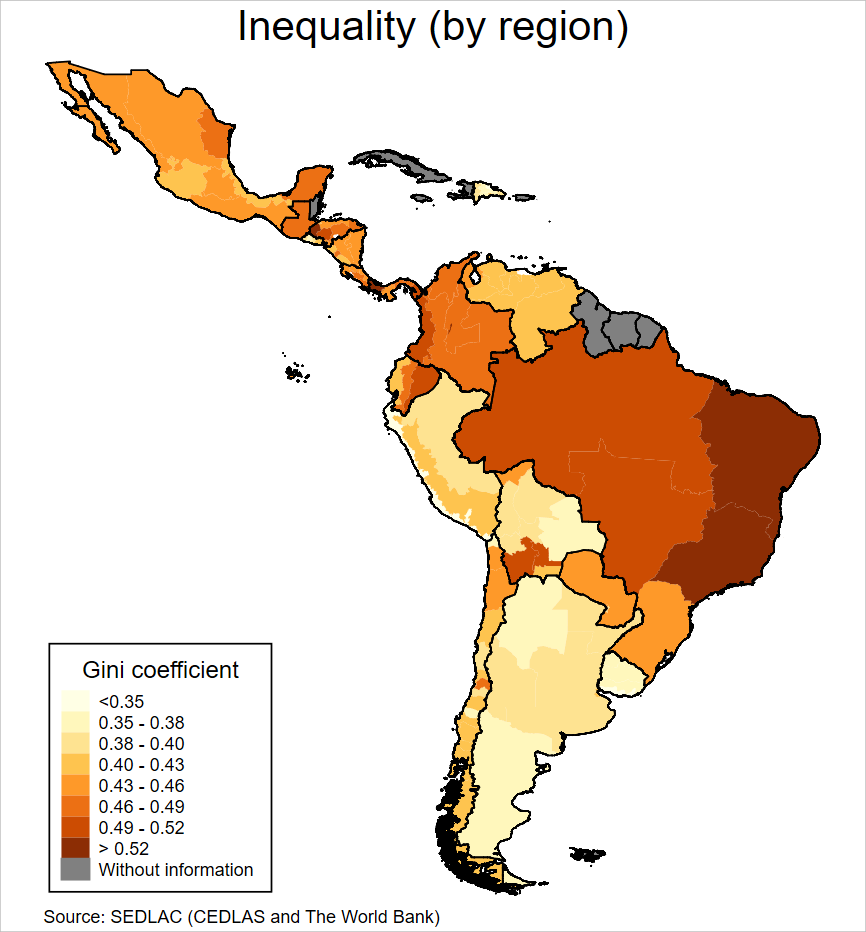
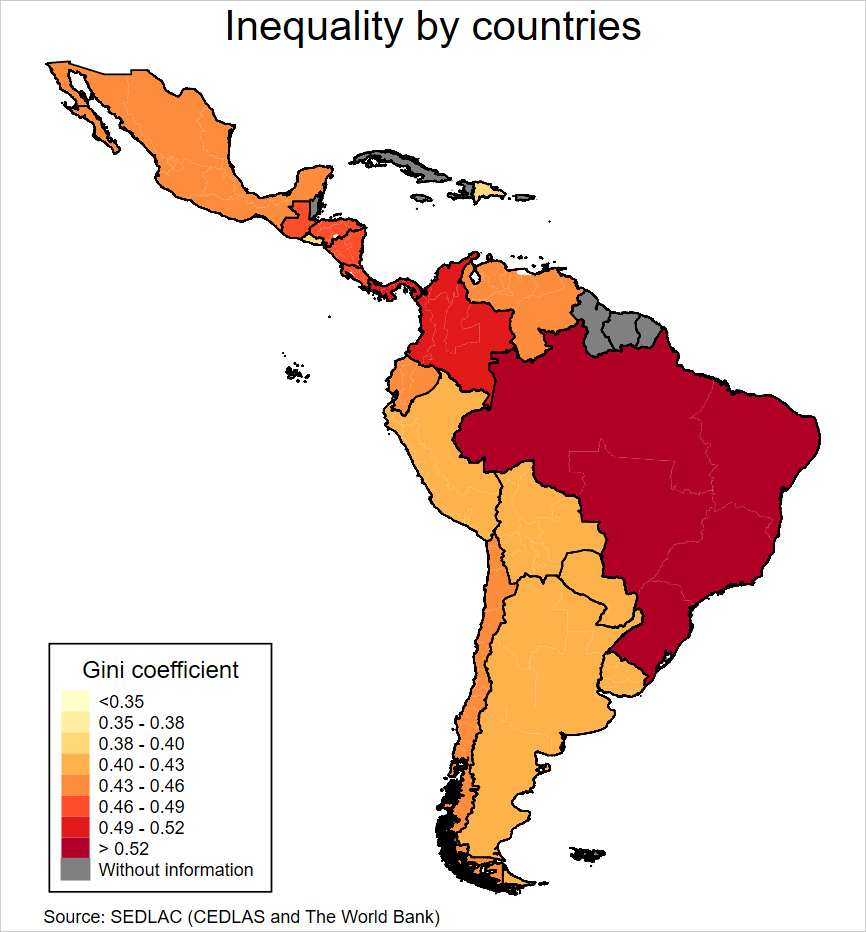
– Inequality indicators computed over the distribution of several income variables
– Share of deciles, income ratios, Gini coefficient, Theil index, coefficient of variation, Atkinson index, and
the generalized entropy index with different parameters
– Polarization indices
Updated: January 2024
This section has two files with information on:
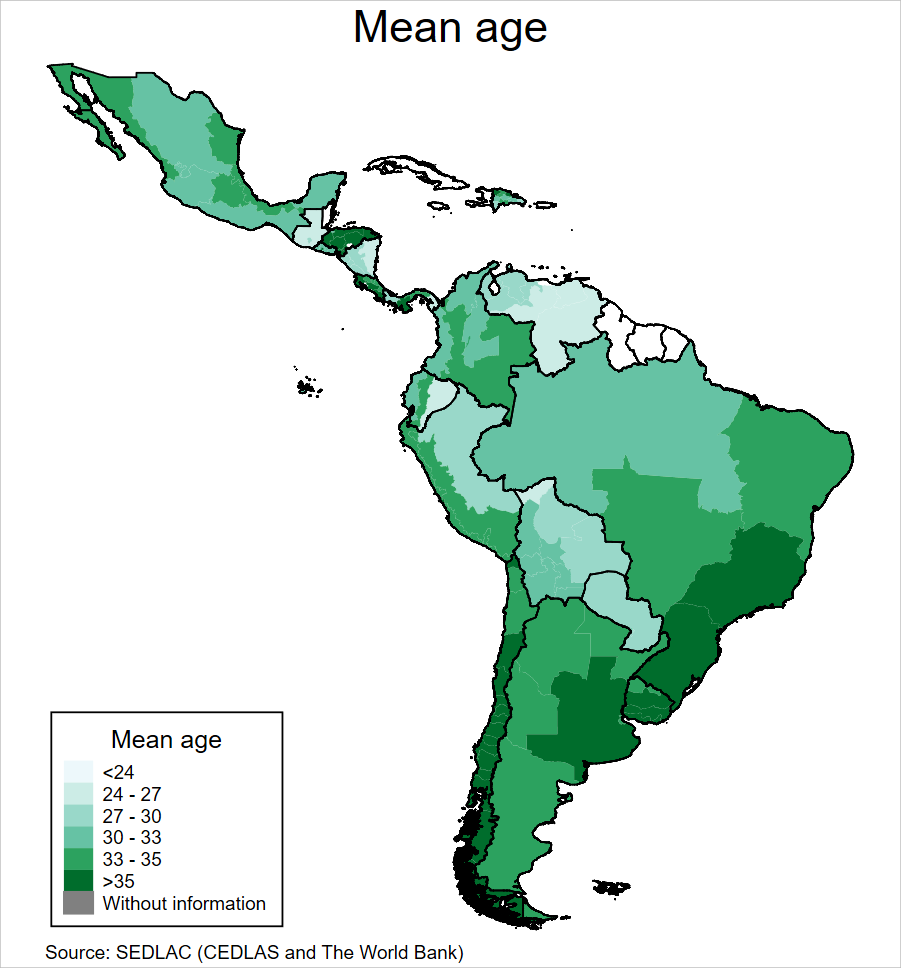
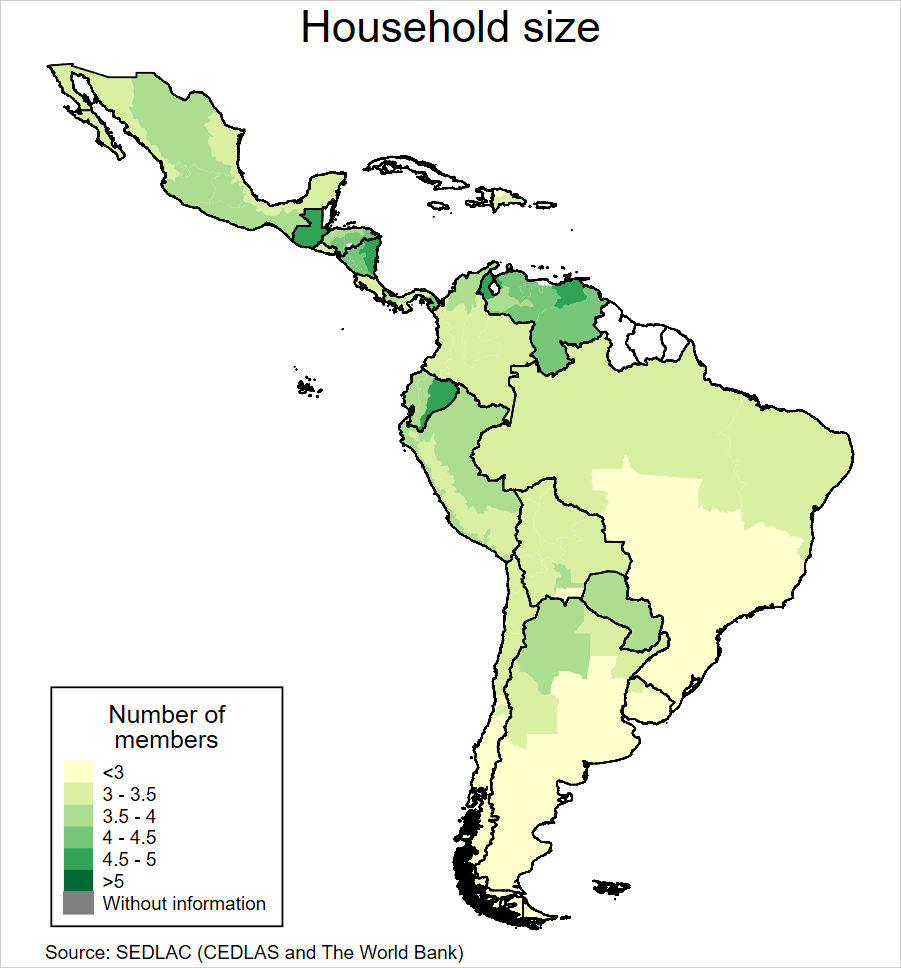
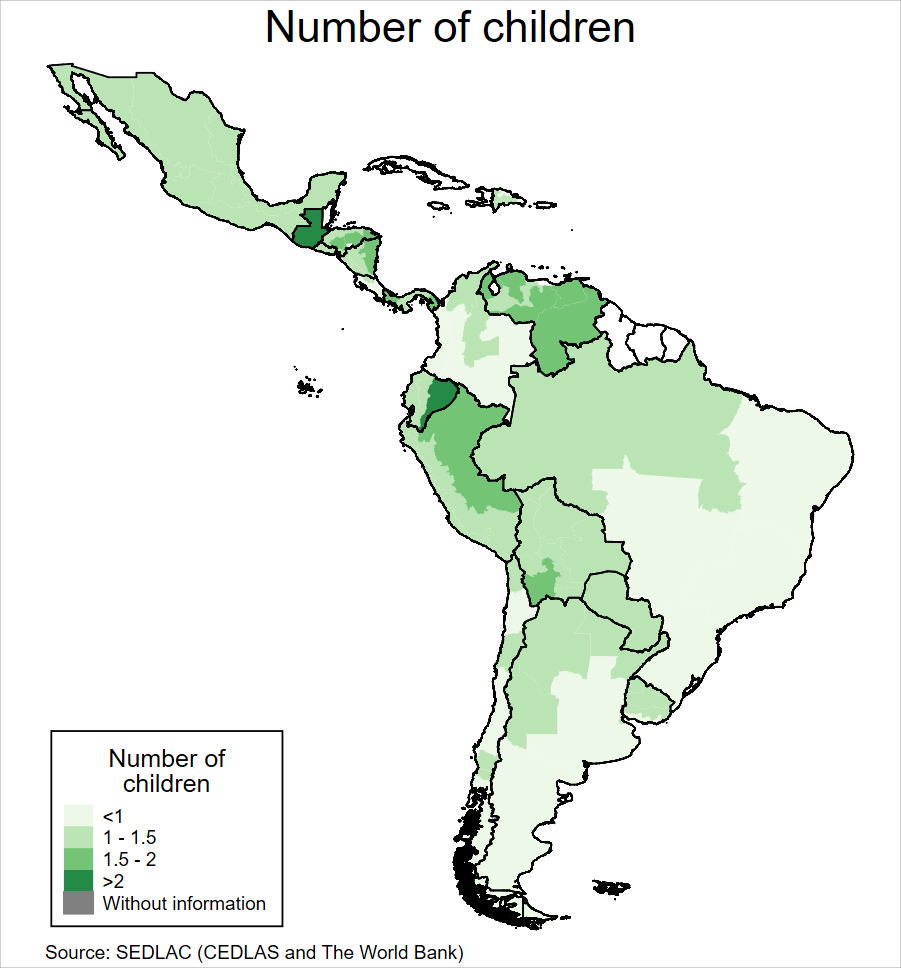
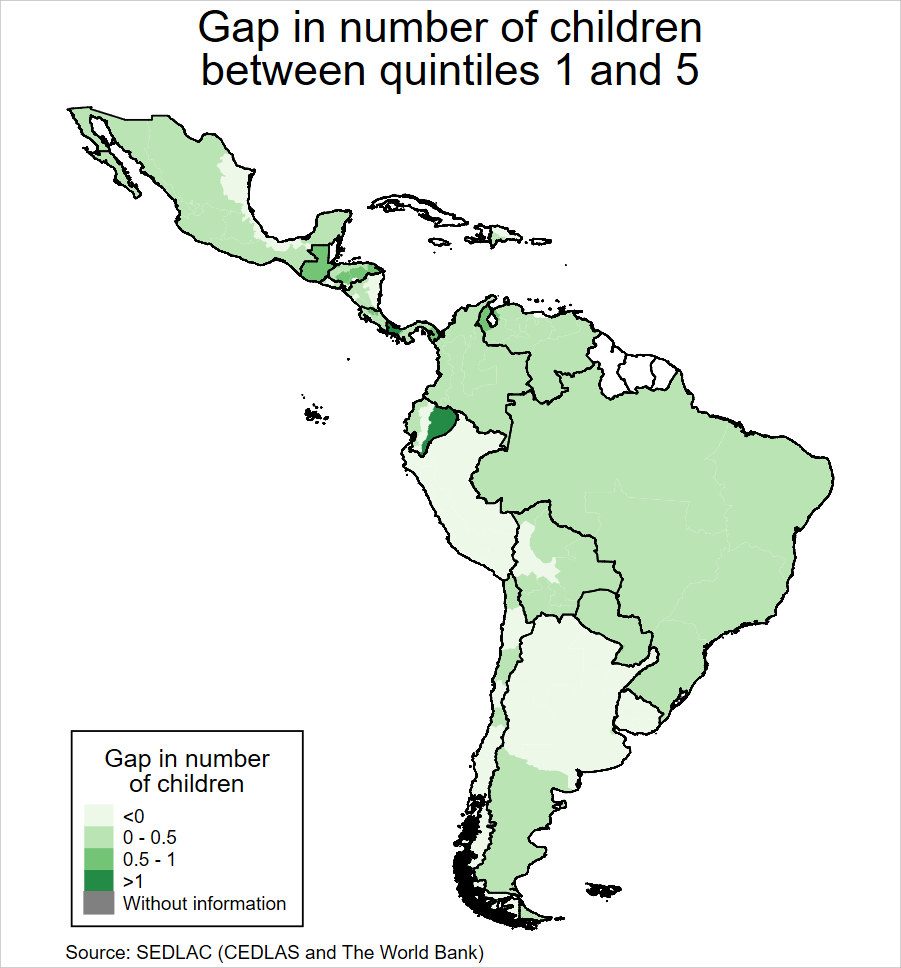
- Demographics
– Household size, number of children under 12 dependency rates, and mean age by income quintiles.
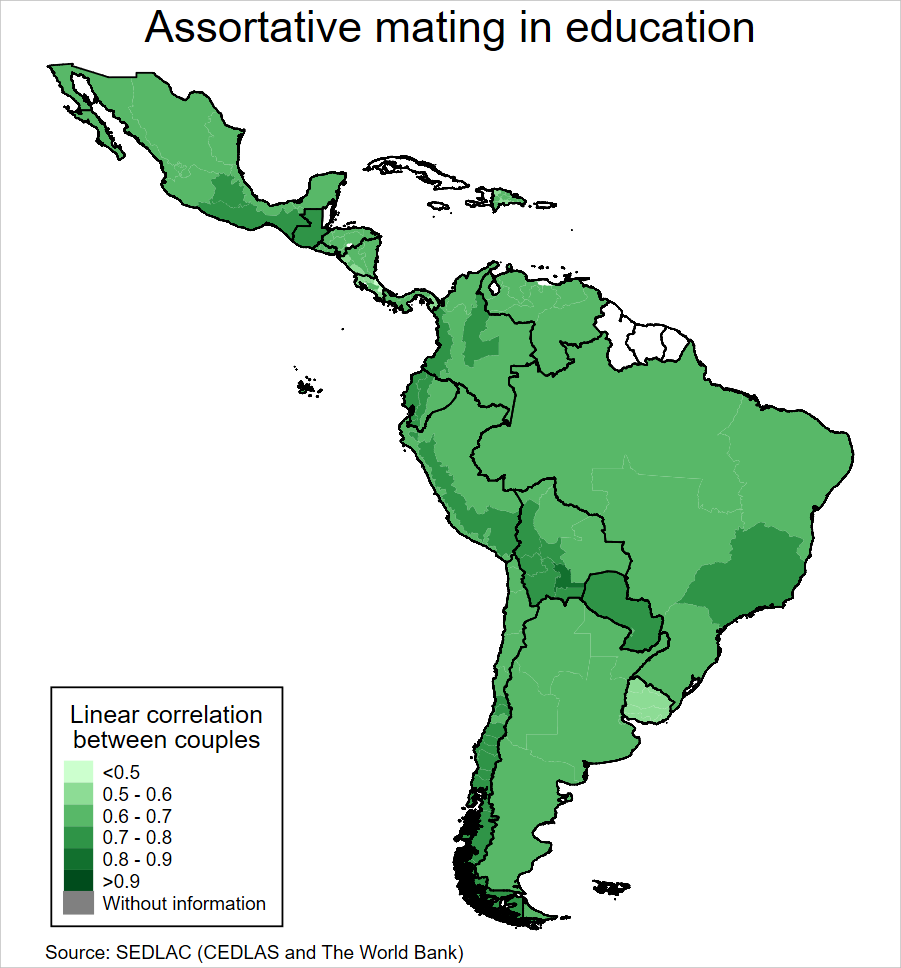
– Assortative mating estimates.
2. Subnational regions and migration
– Distribution of the population by areas (urban-rural) and subnational regions.
– Statistics on migration.
Updated: January 2024
This section has four files, which include estimations on:
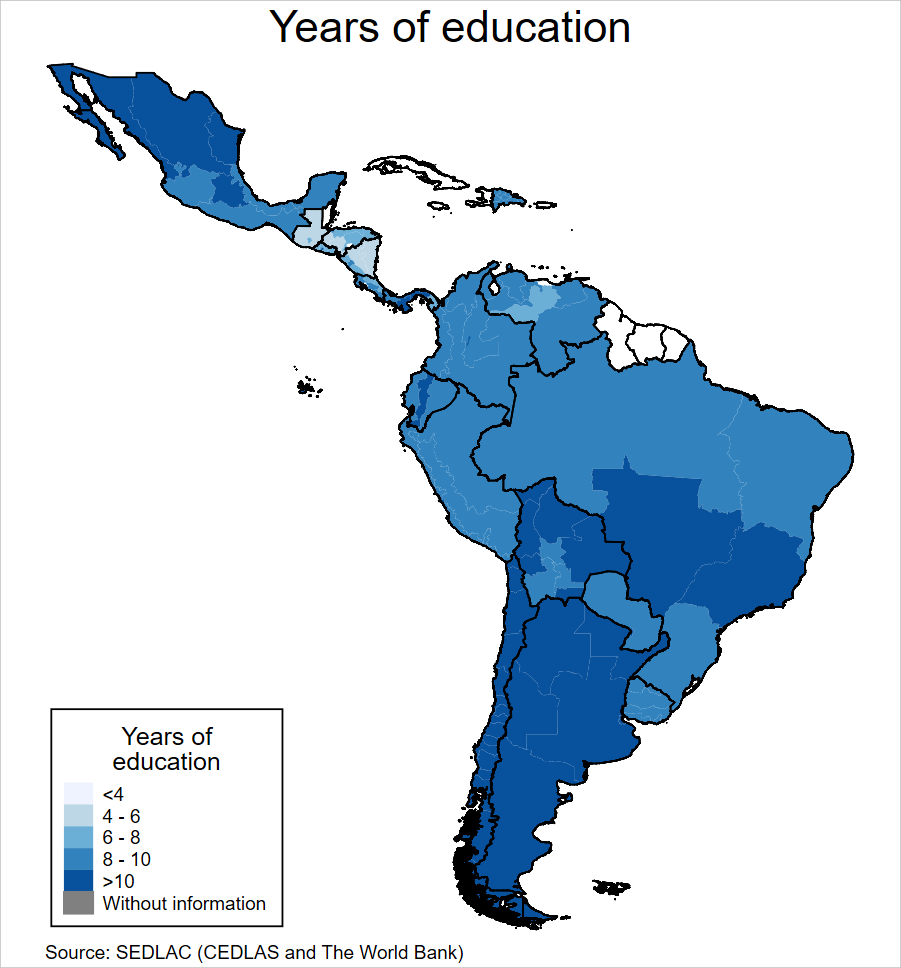
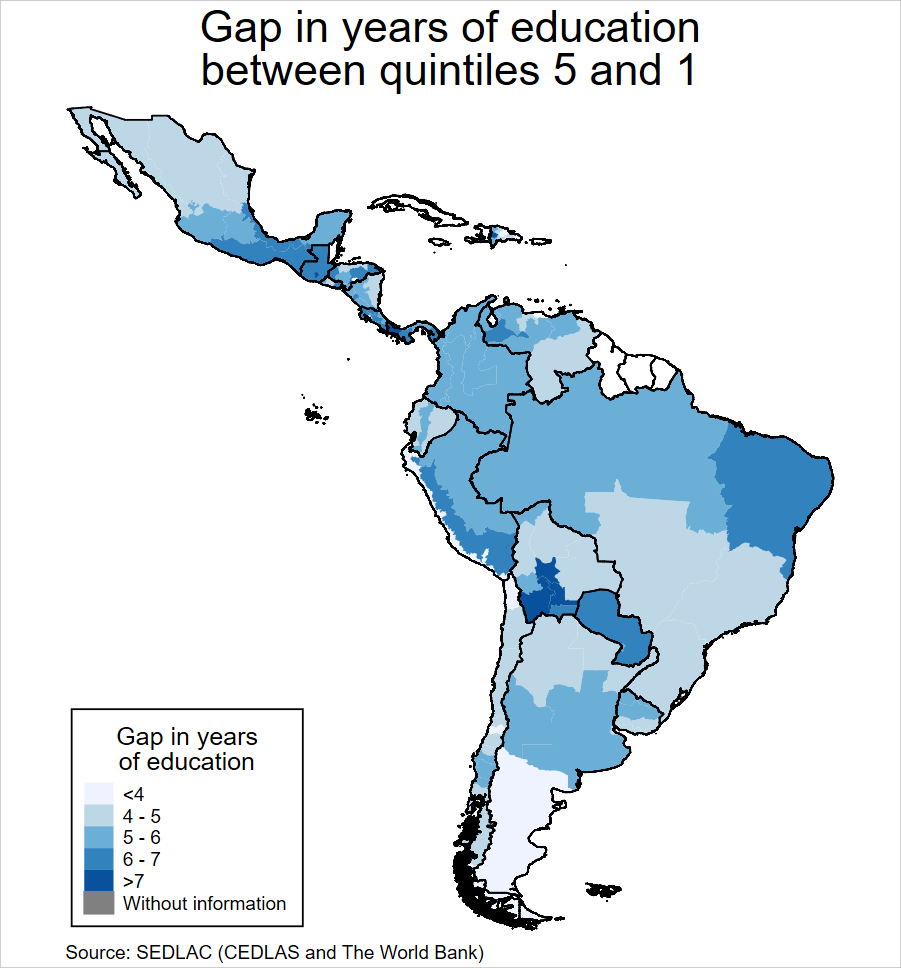
1. Years of education:
– Educational structure of adults aged 25 to 65.
– Average years of schooling in formal education by gender, area, and income quintiles.
– Gini coefficients for the distribution of years of education.
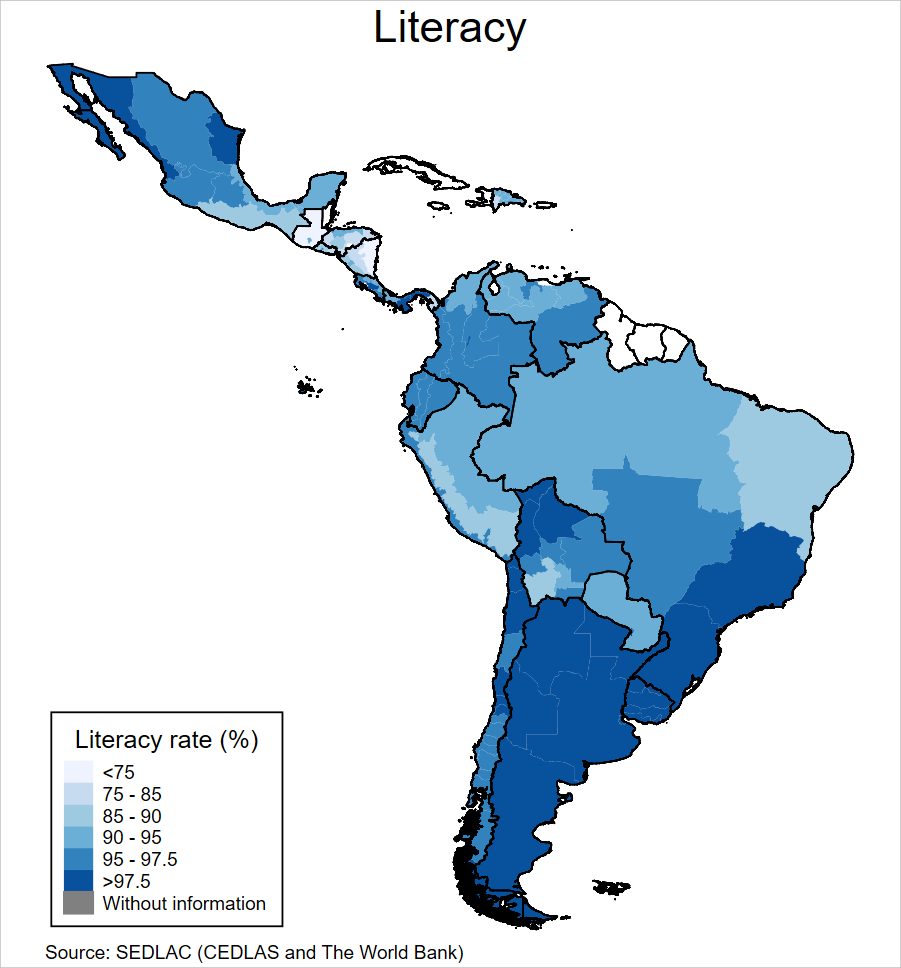
2. Literacy
– Literacy rates by age, gender, income quintiles, and areas.
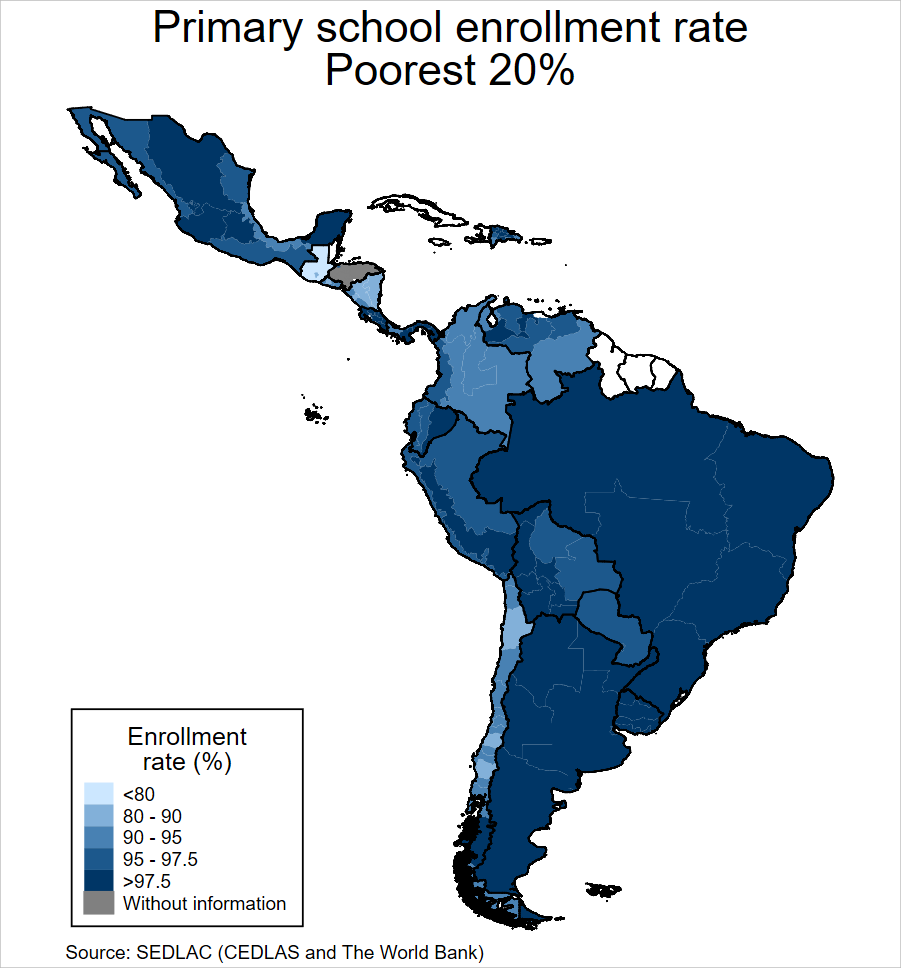
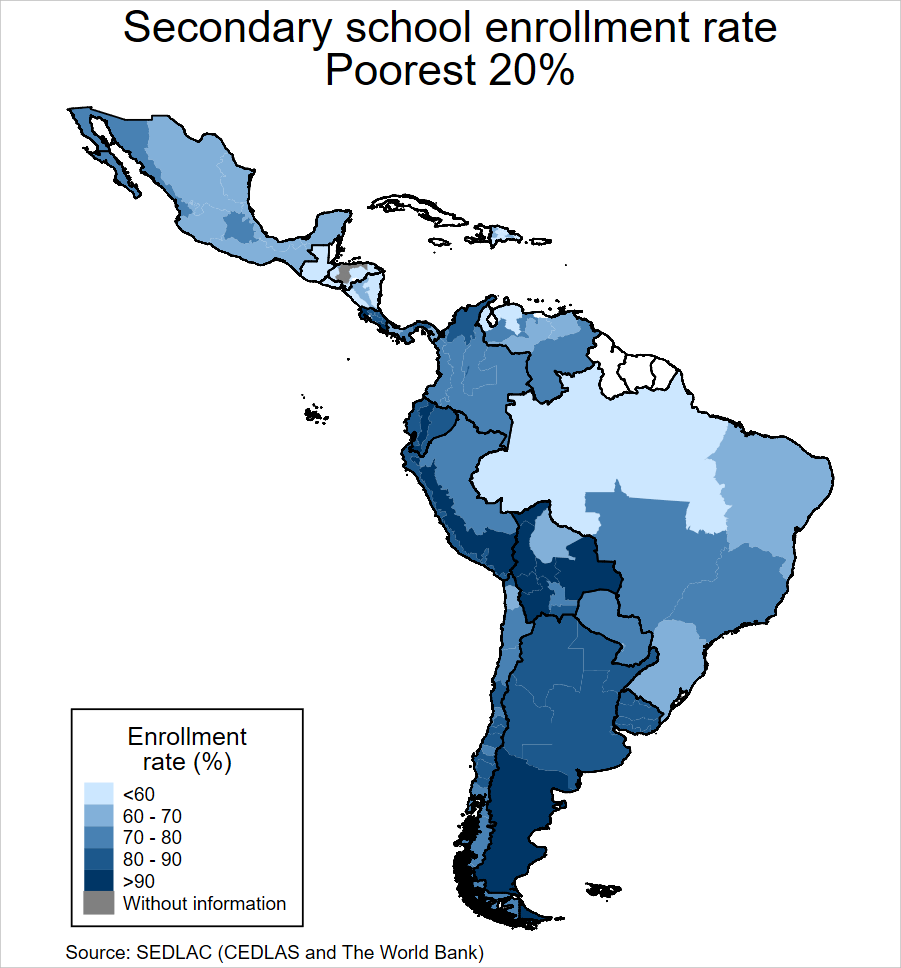
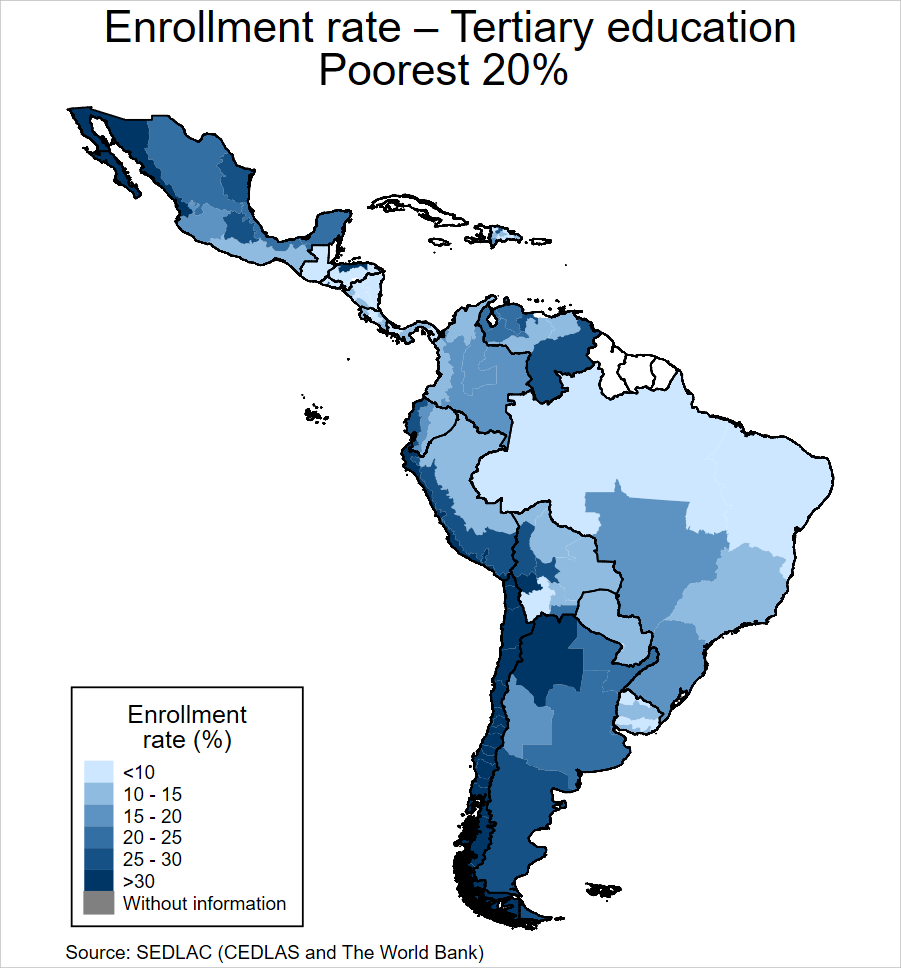
3. School Attendance
– Gross school attendance rates for children and youth aged 3 to 23.
– Enrollment rates by age, gender, area and income quintiles.
– Net enrollment in primary, secondary, and superior education.
– Primary completion rates.
4. Mobility
– Educational Mobility Index: 1 minus the proportion of the variance of the school gap that is explained by parental education and income (Andersen, 2001).
Updated: January 2024
This section has three files, which contain estimates on:
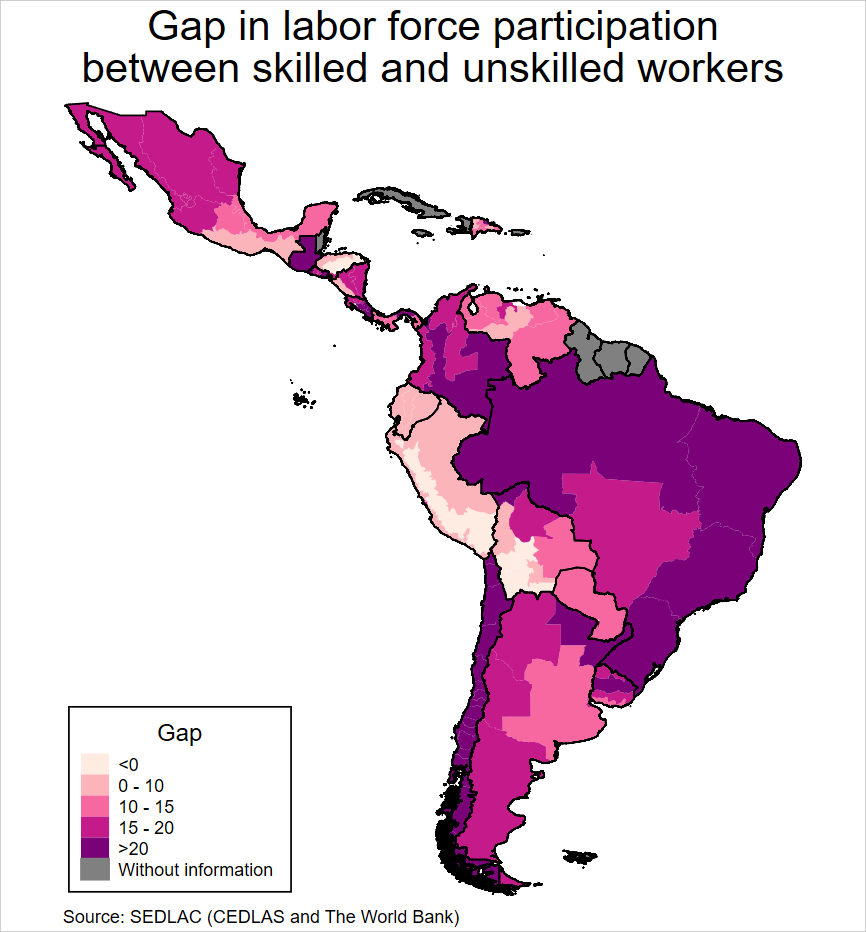
1. Employment
– Labor force participation.
– Employment and unemployment rates.
– Unemployment duration.-
– Structure of employment by gender, age, education, area, and region.-
– Structure of employment by labor relationship, type of firm, and sector.
– Informality by age, gender, education, and area.
– Child labor.
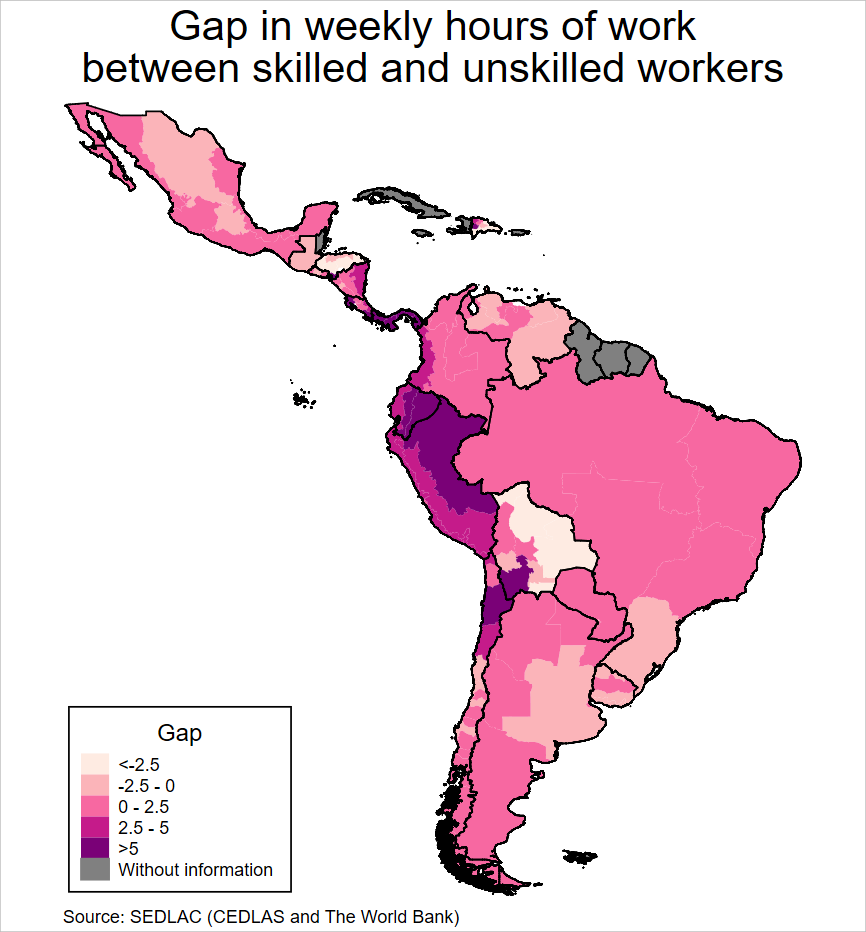
2. Wages and hours of work
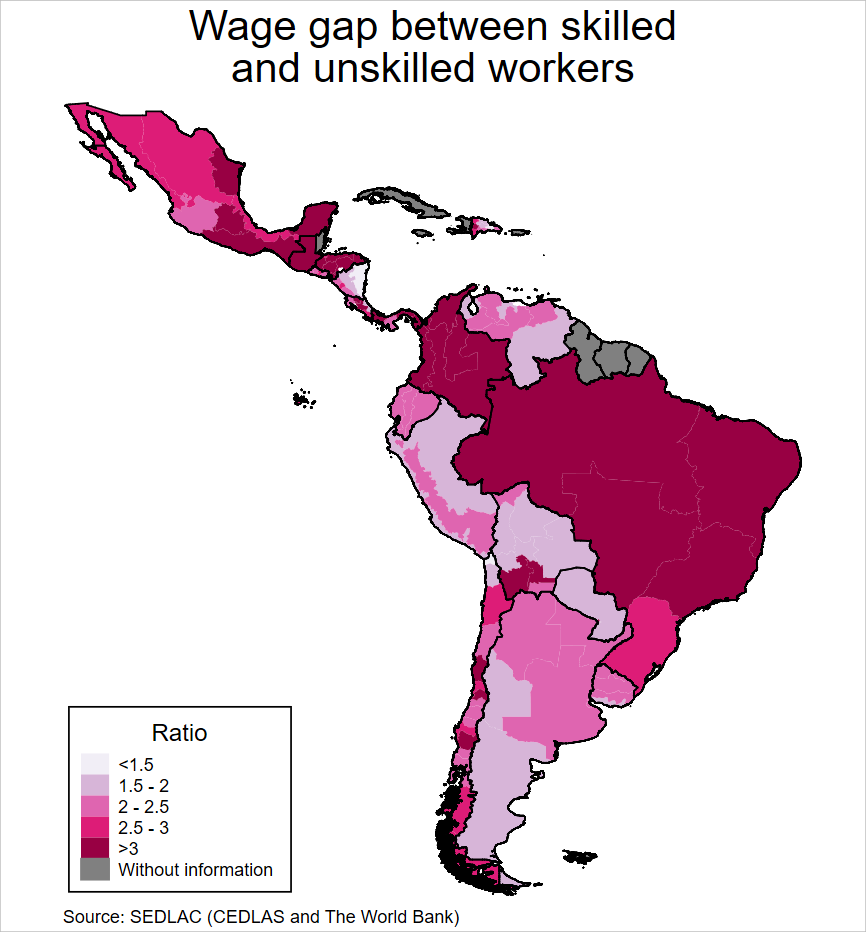
– Hourly wages, hours of work and labor income by age, gender, education, area, sector, and type of work.
– Earnings inequality and wage gaps.
– Coefficients of Mincer equations.
– Conditional gender wage gaps.
3. Labor benefits
– Contracts, pensions, health insurance by age, gender, education, and area.
– 13th month, holidays, unions.
Updated: DJanuary 2024
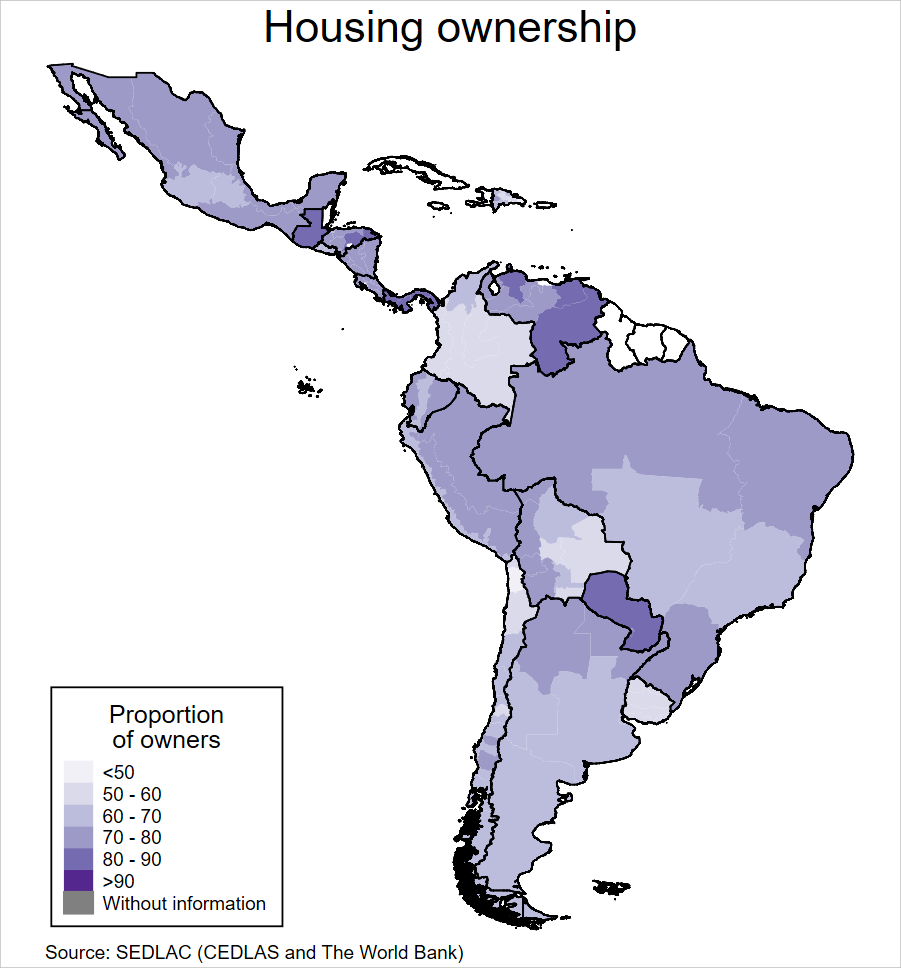
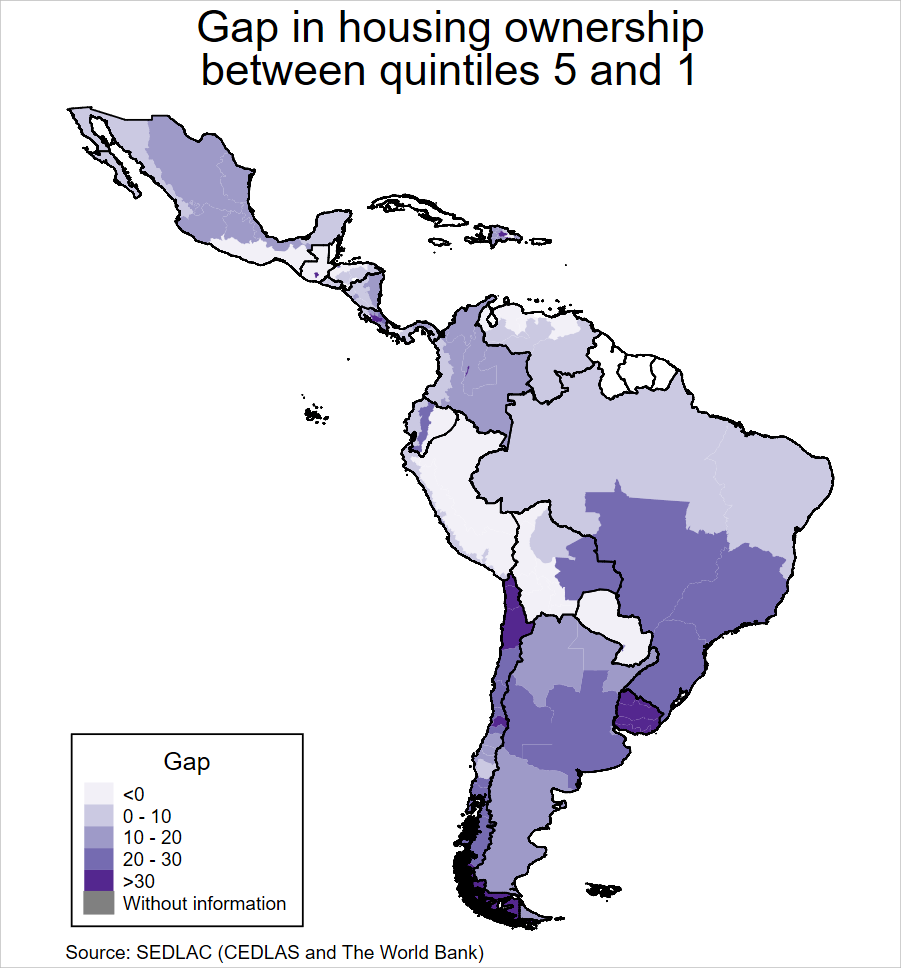
The Excel file includes estimates on ownership, number of rooms, persons per room and quality of the dwelling, by income quintiles, education and age of the household head.
Updated: January 2024
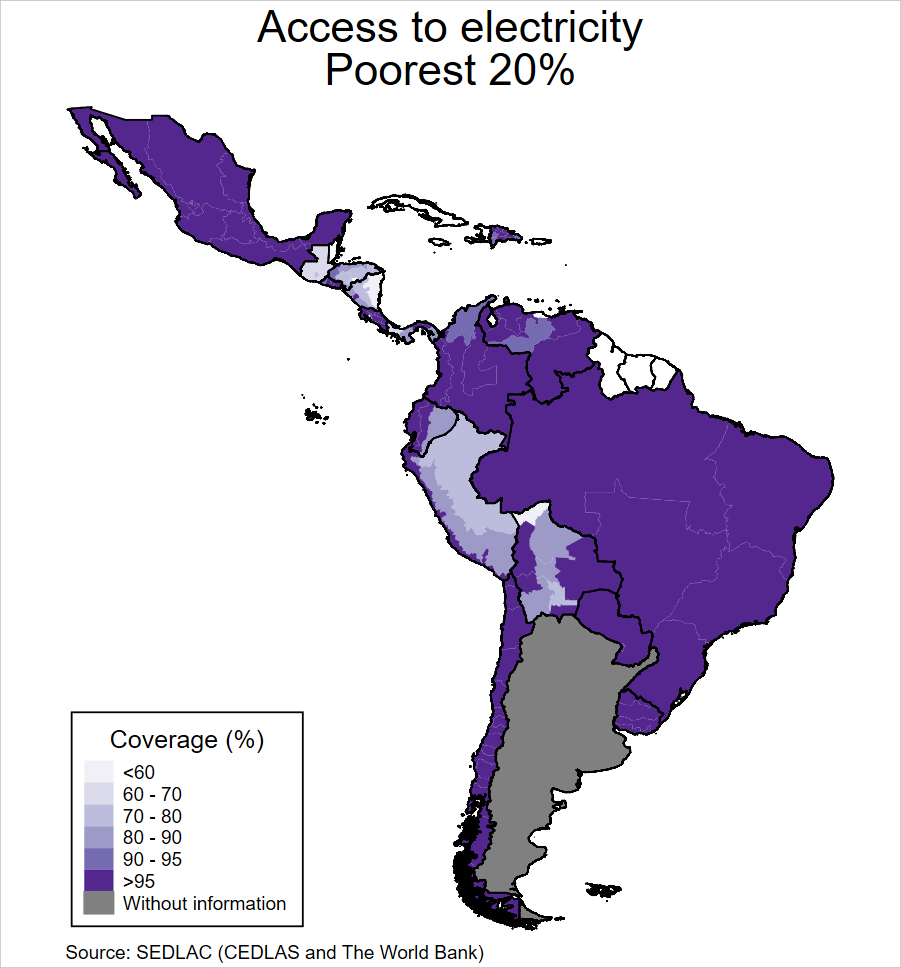
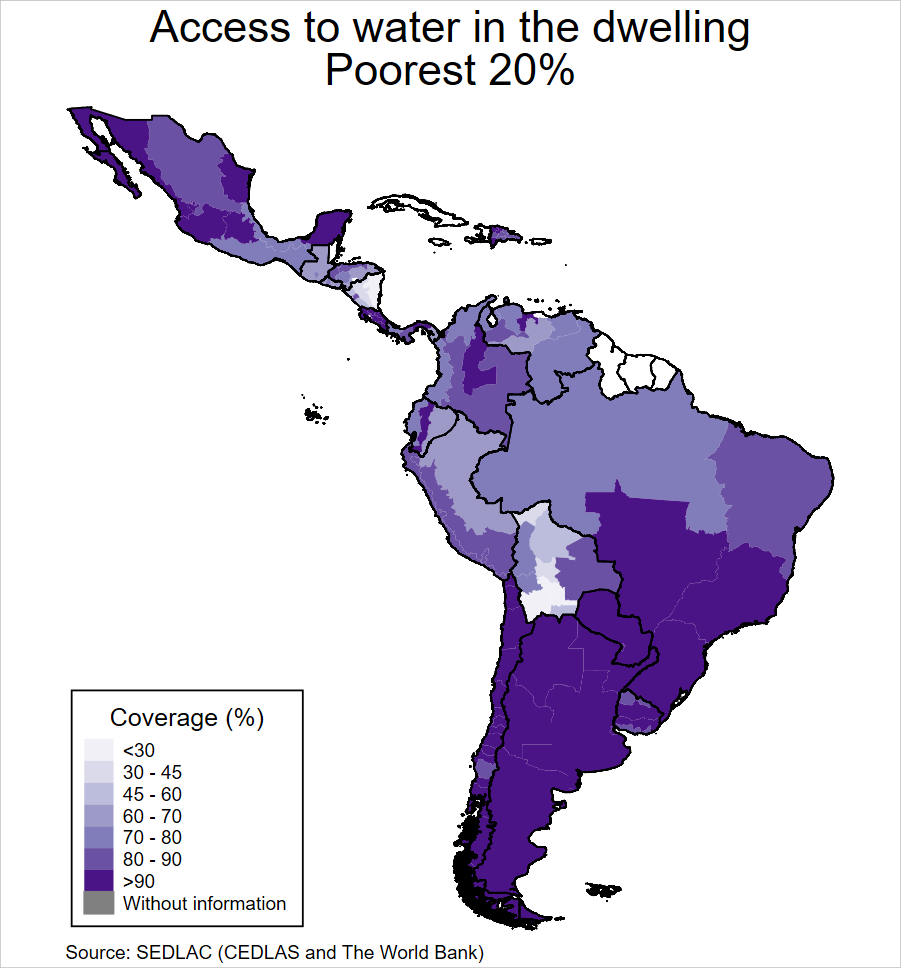
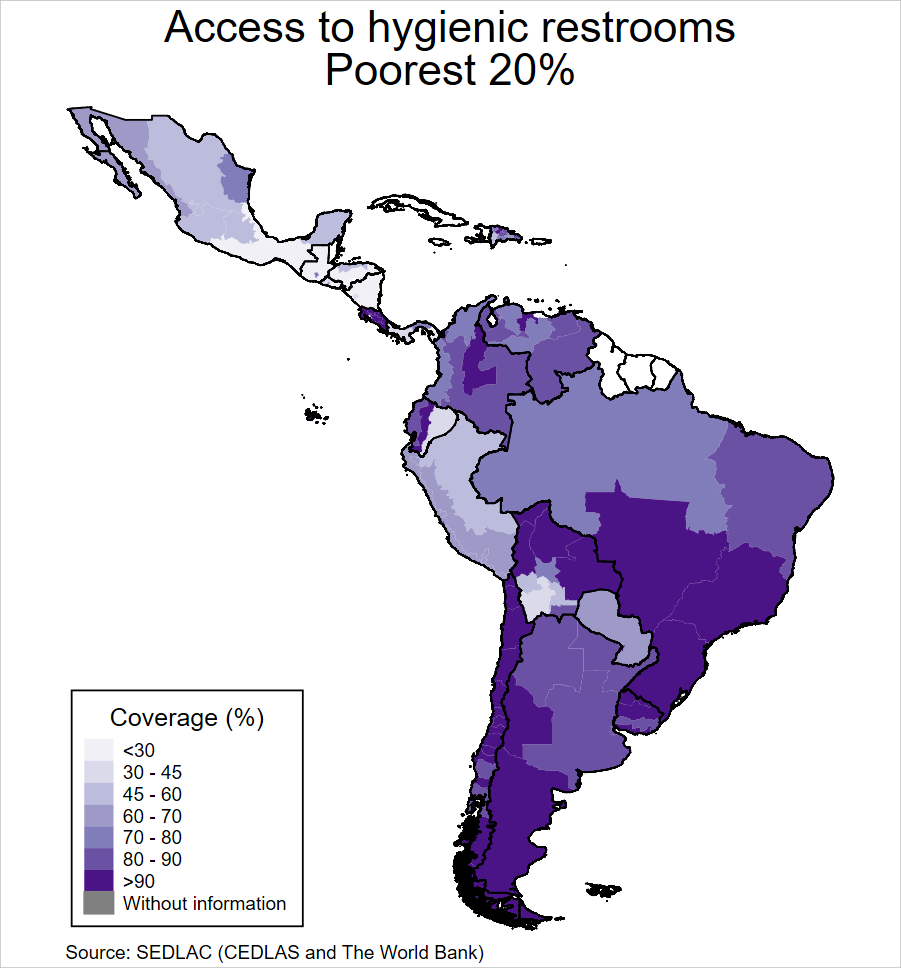
The Excel file includes estimates on access to running water, electricity, restrooms, sewerage and phone, by area and income quintiles.
Updated: January 2024
The LAC Equity Lab is a data-sharing platform featuring the latest microdata, indicators, tools, and analytics on poverty, shared prosperity, inequality, and equity in Latin America and the Caribbean. Explore the dashboards below for an in-depth look at the latest trends by country and region, and use our helpful tutorial to get the most out of the site.
The LAC Equity Lab is available at: www.worldbank.org/equitylab.
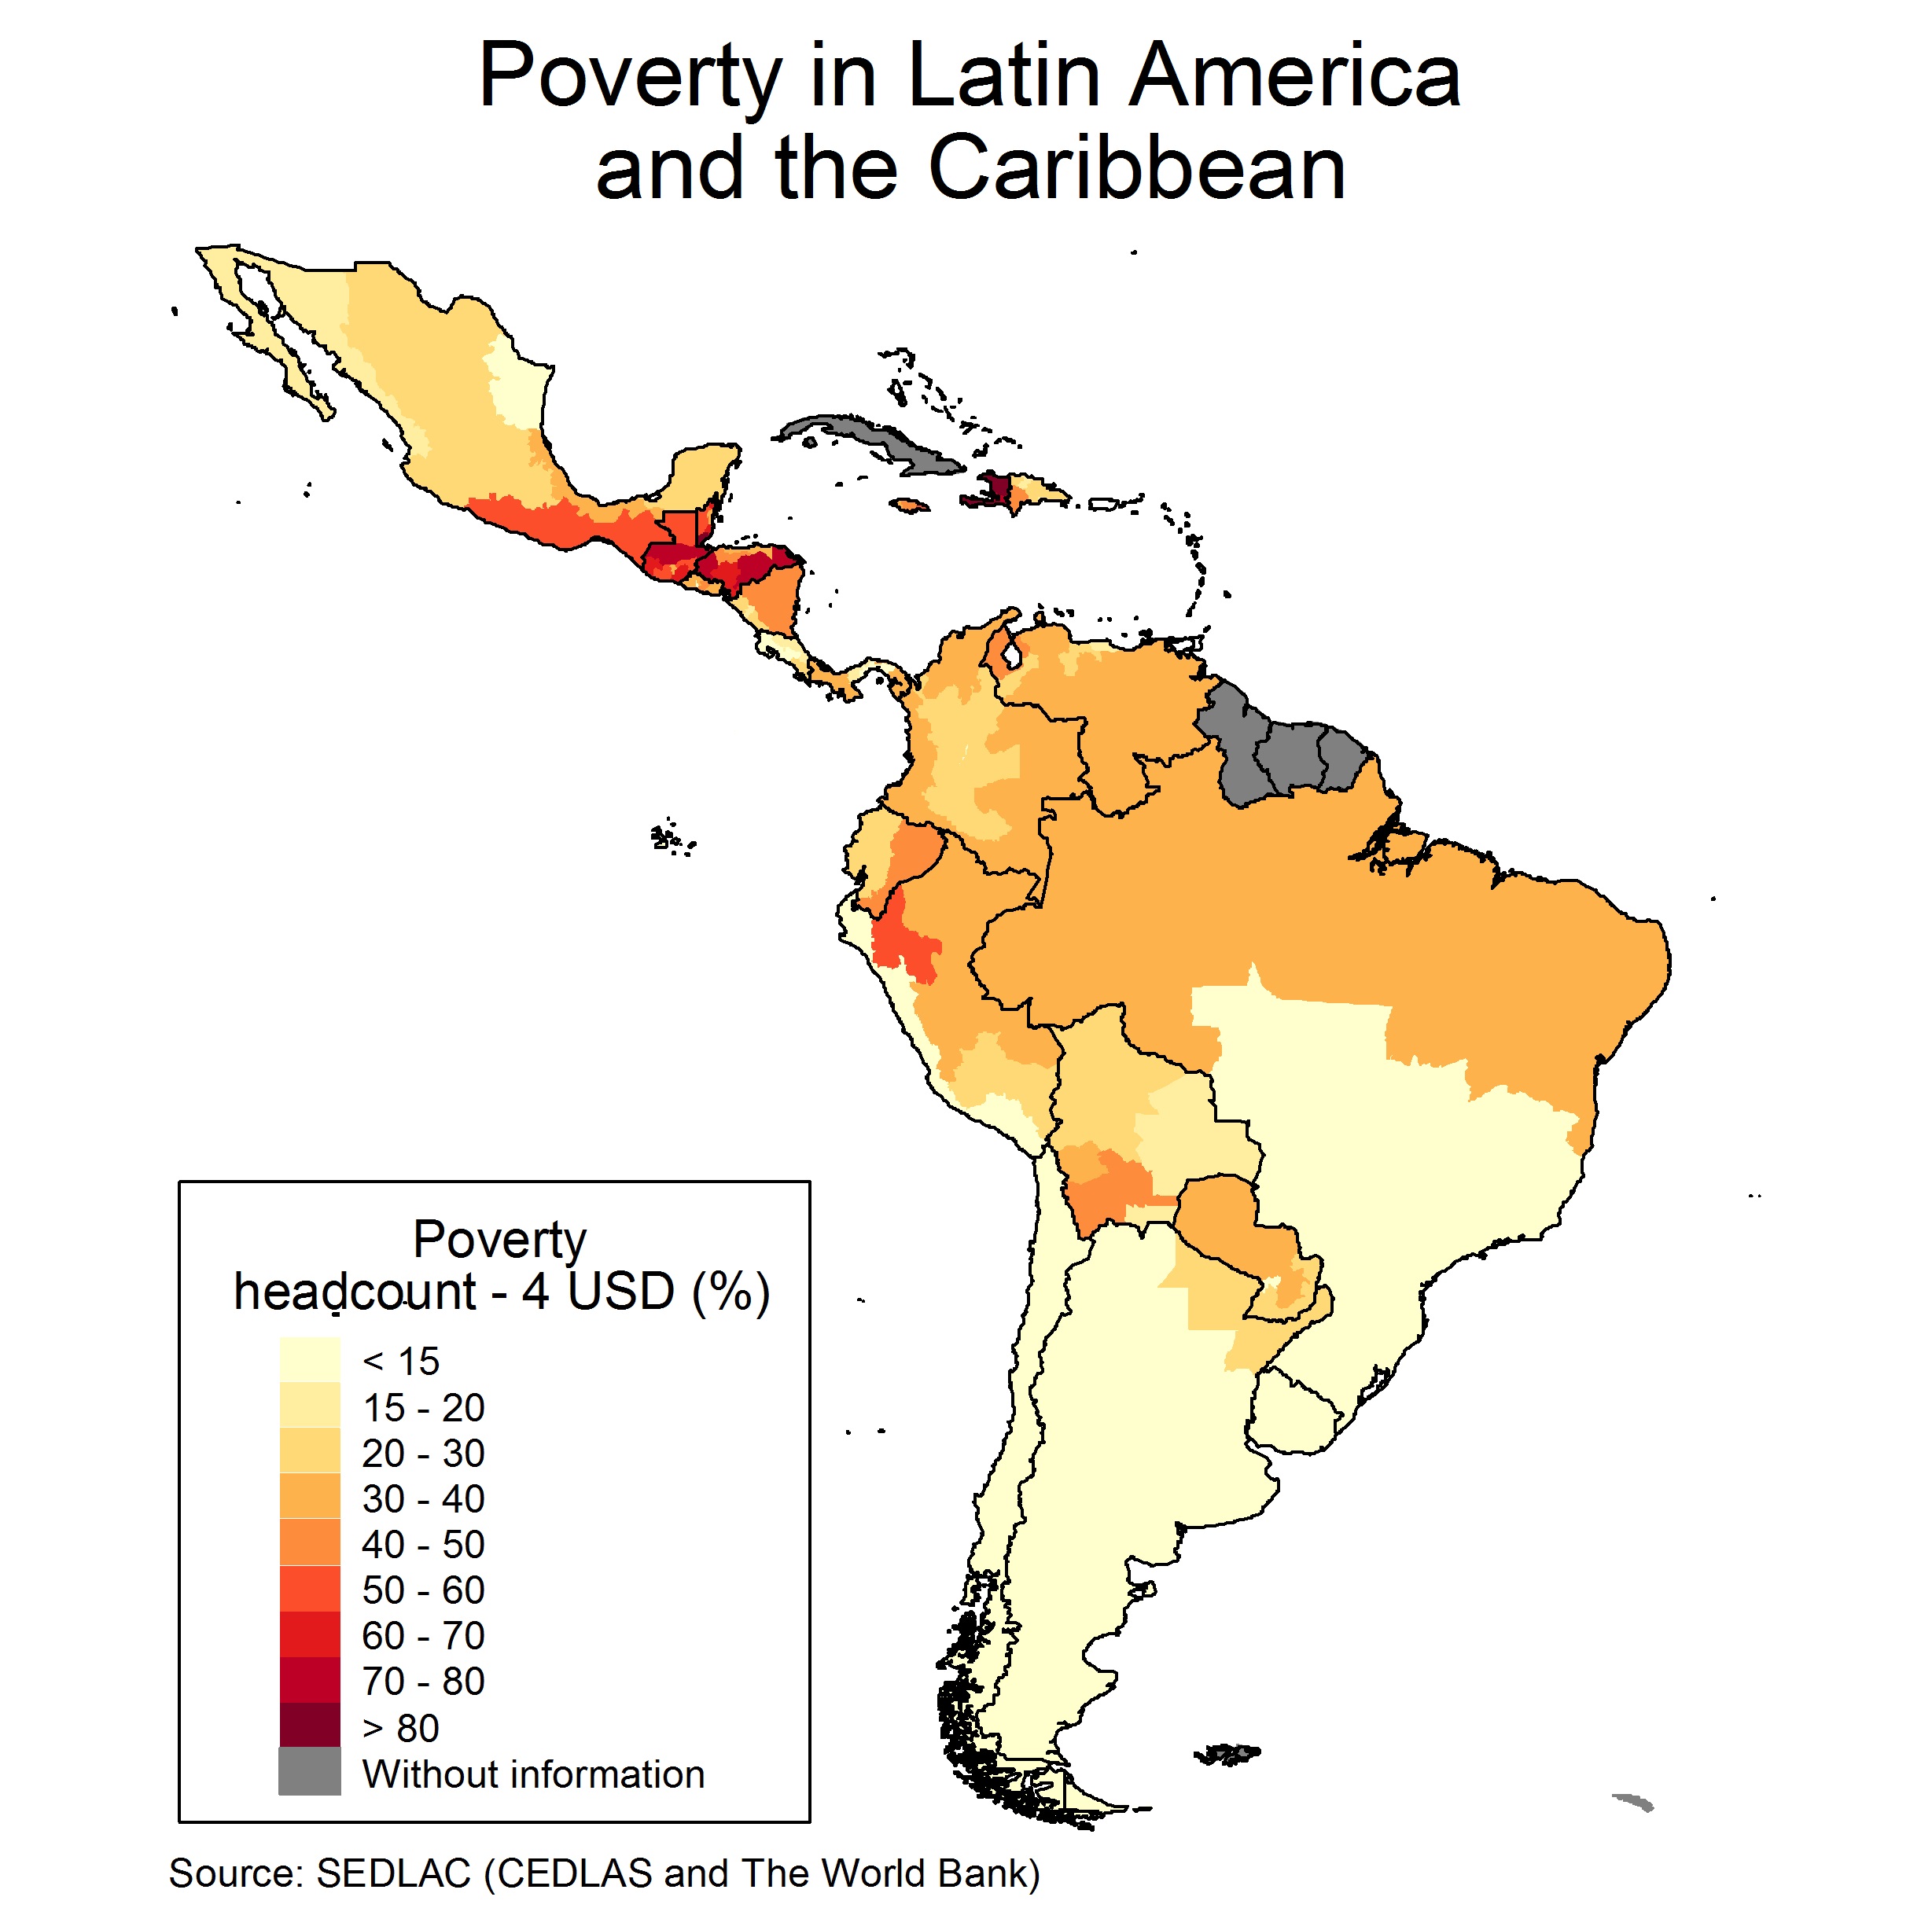
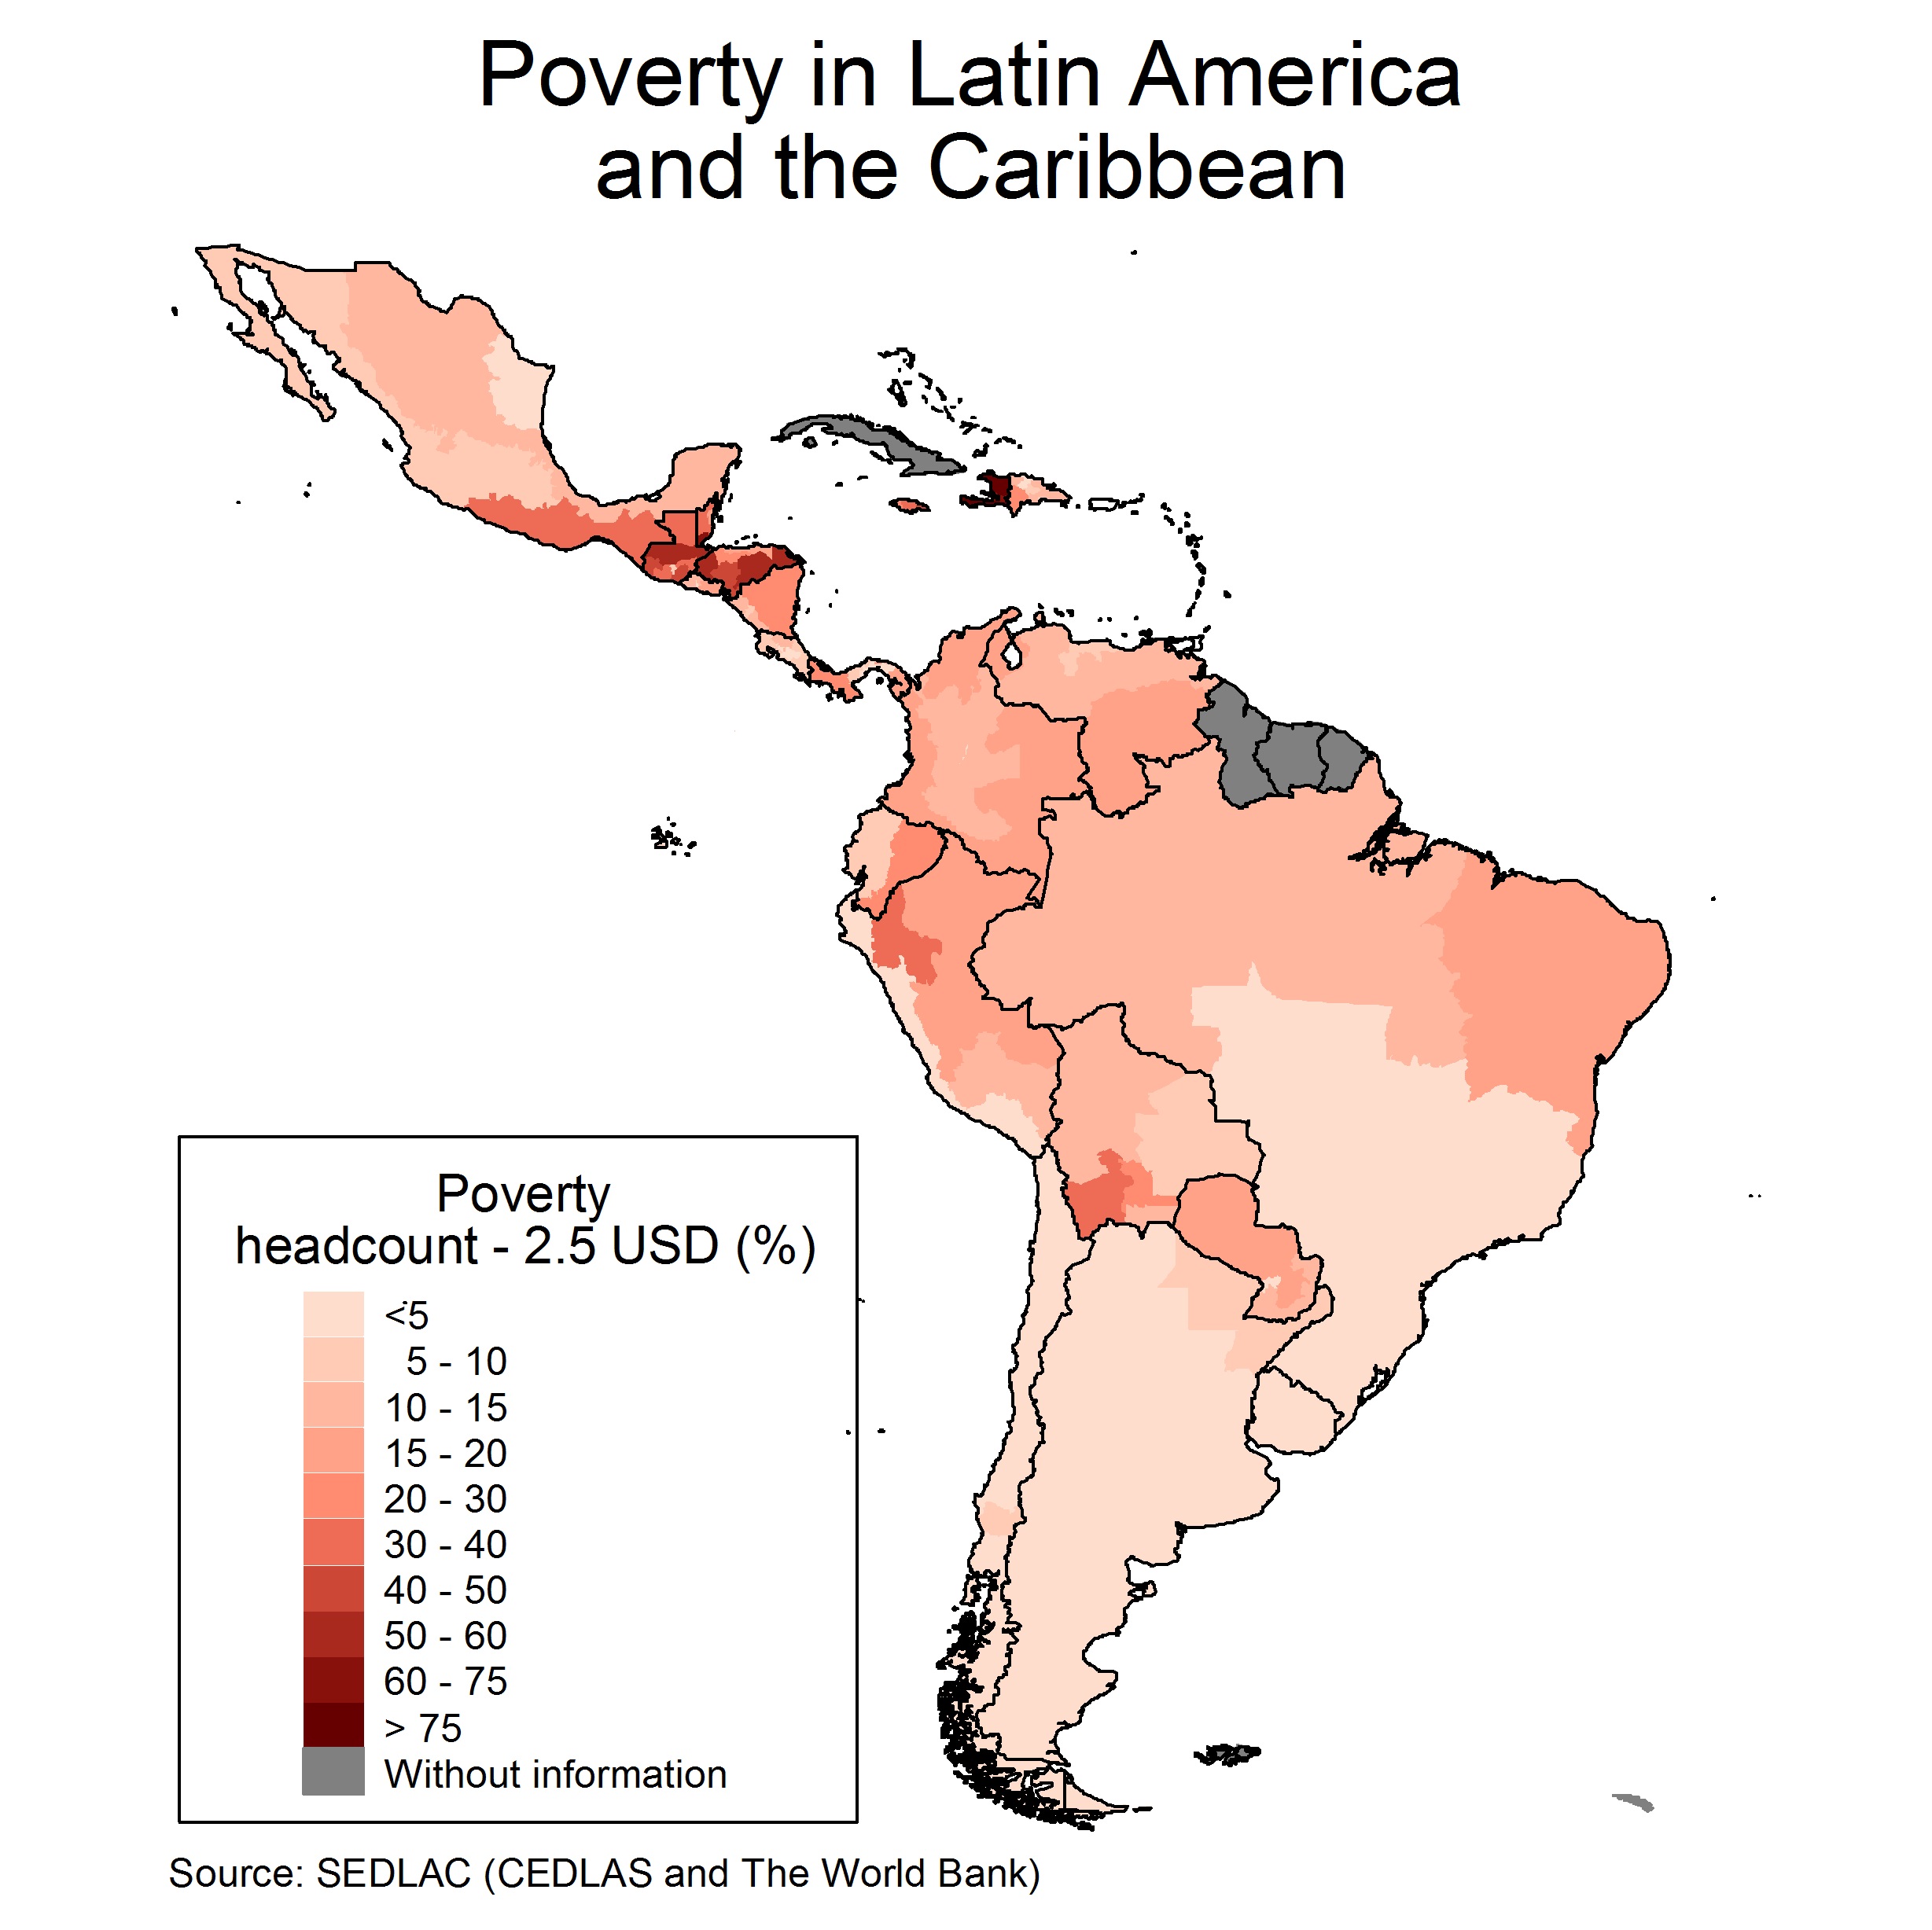
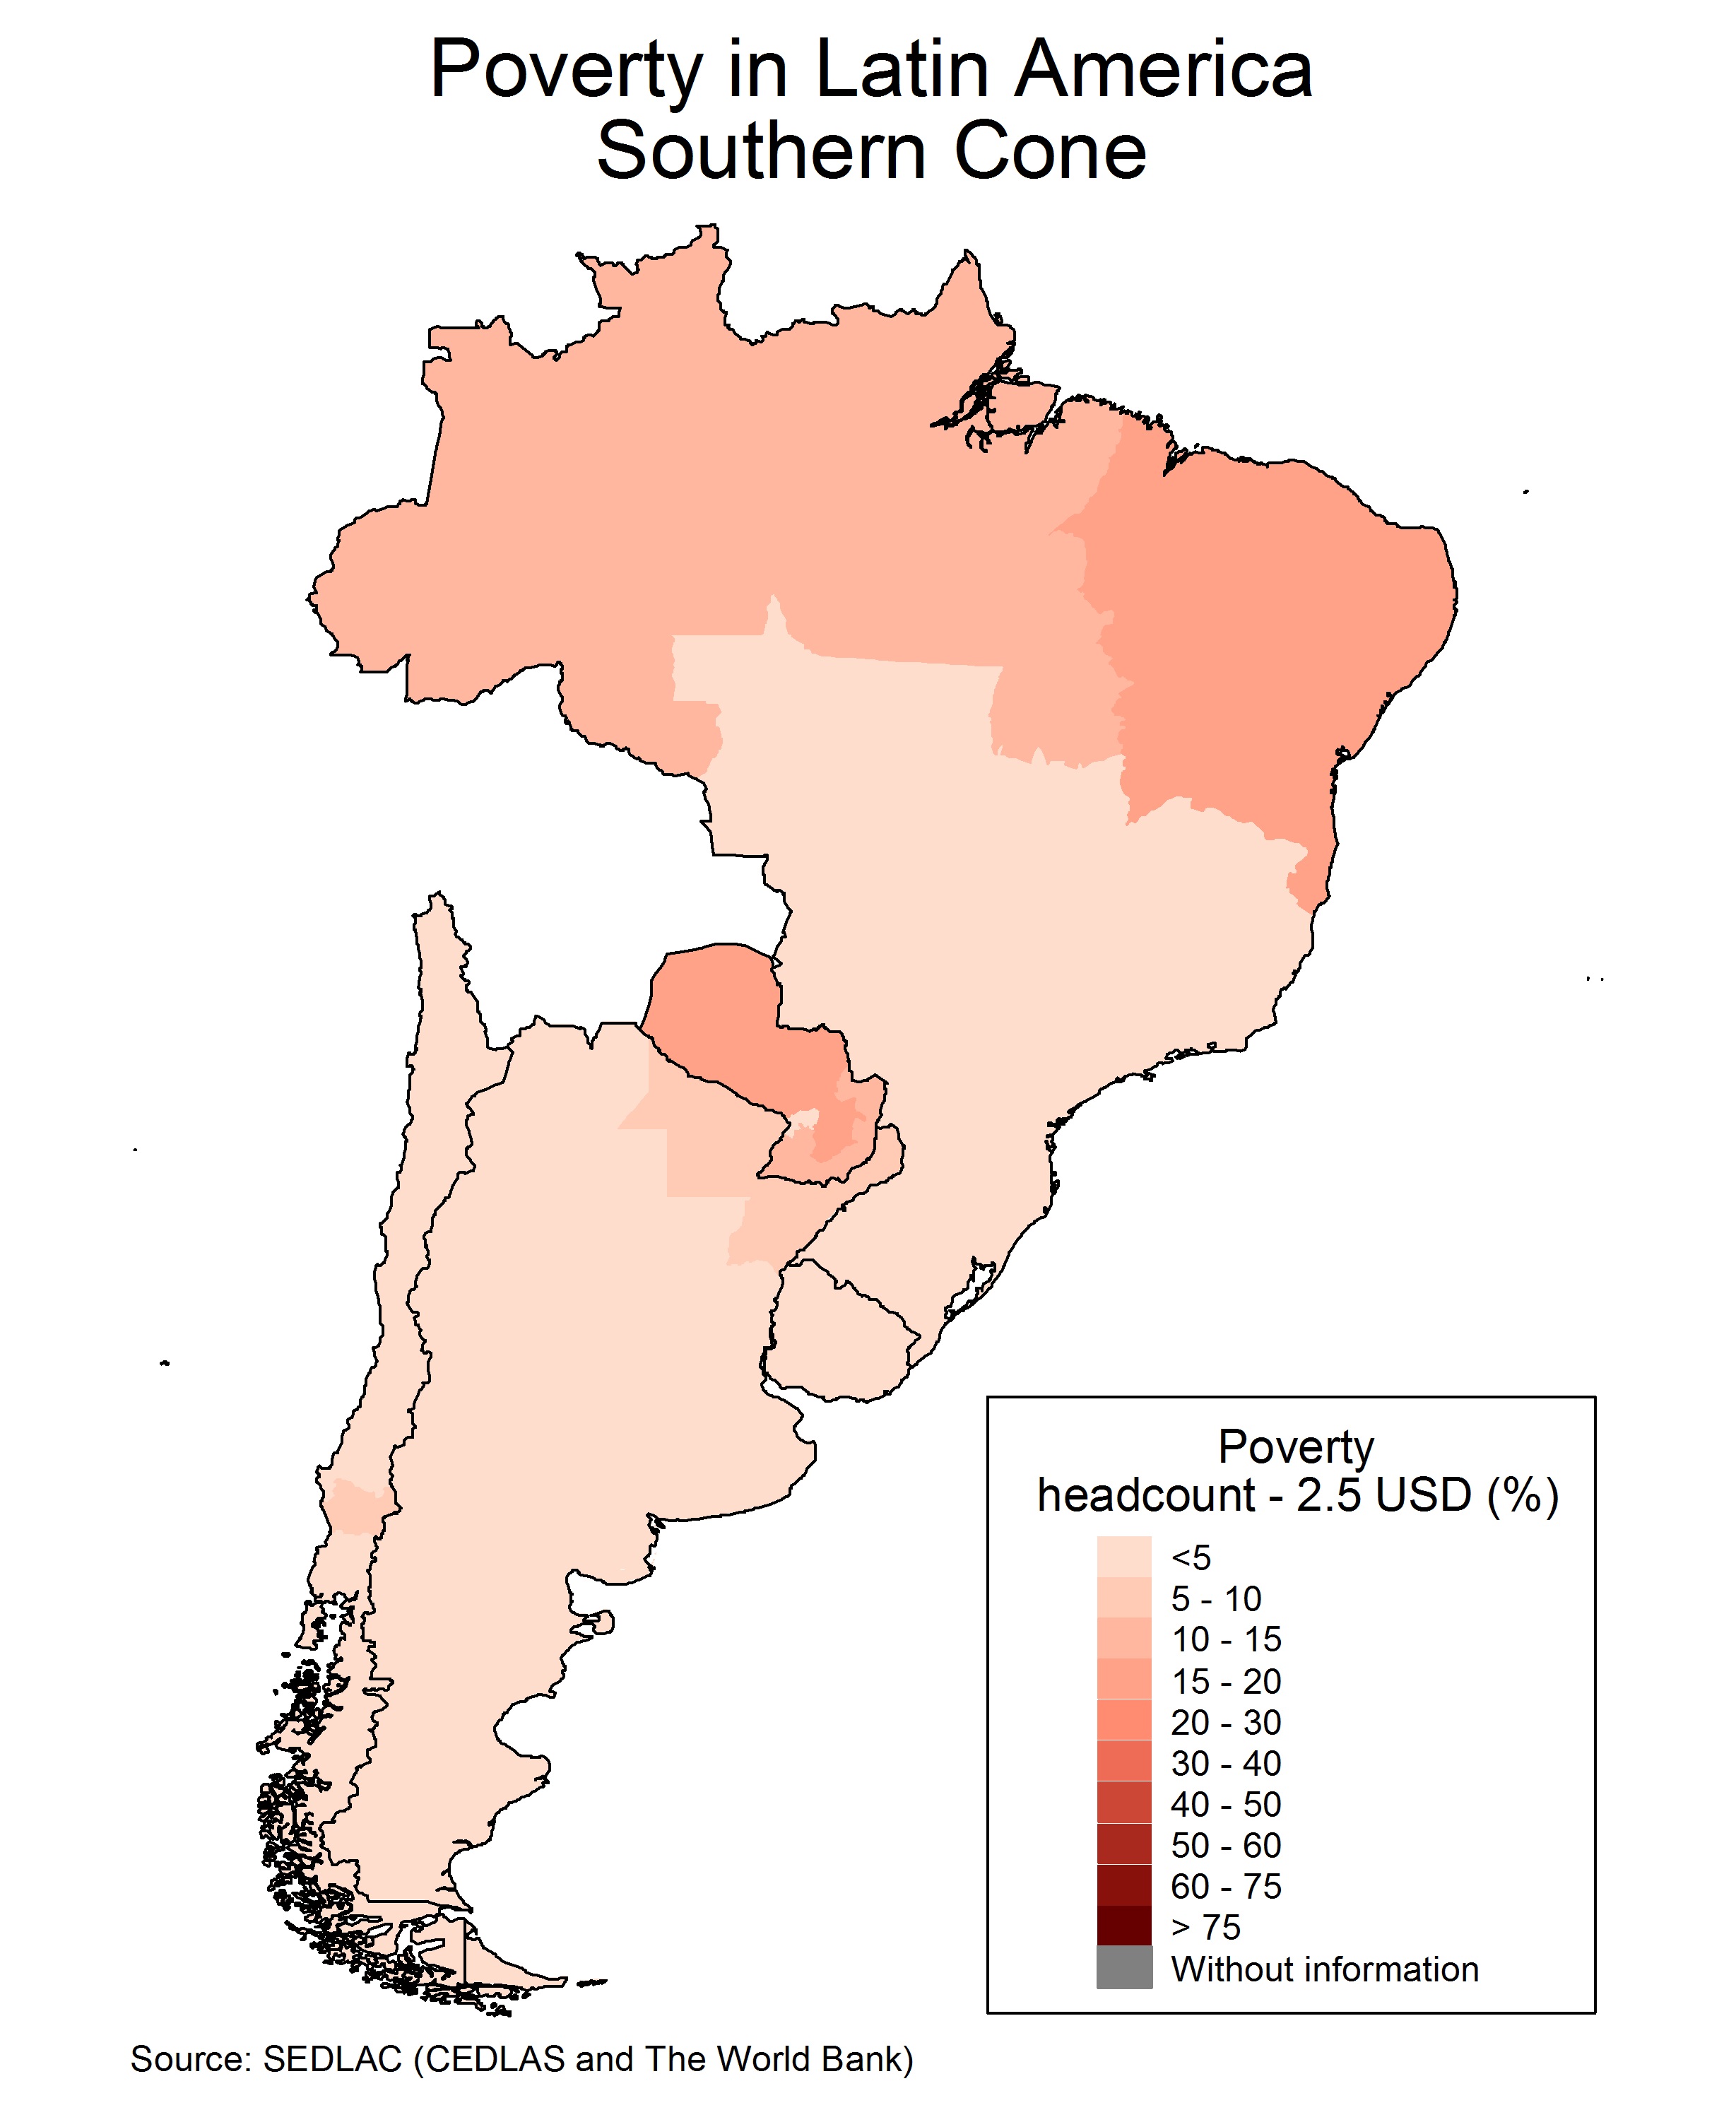
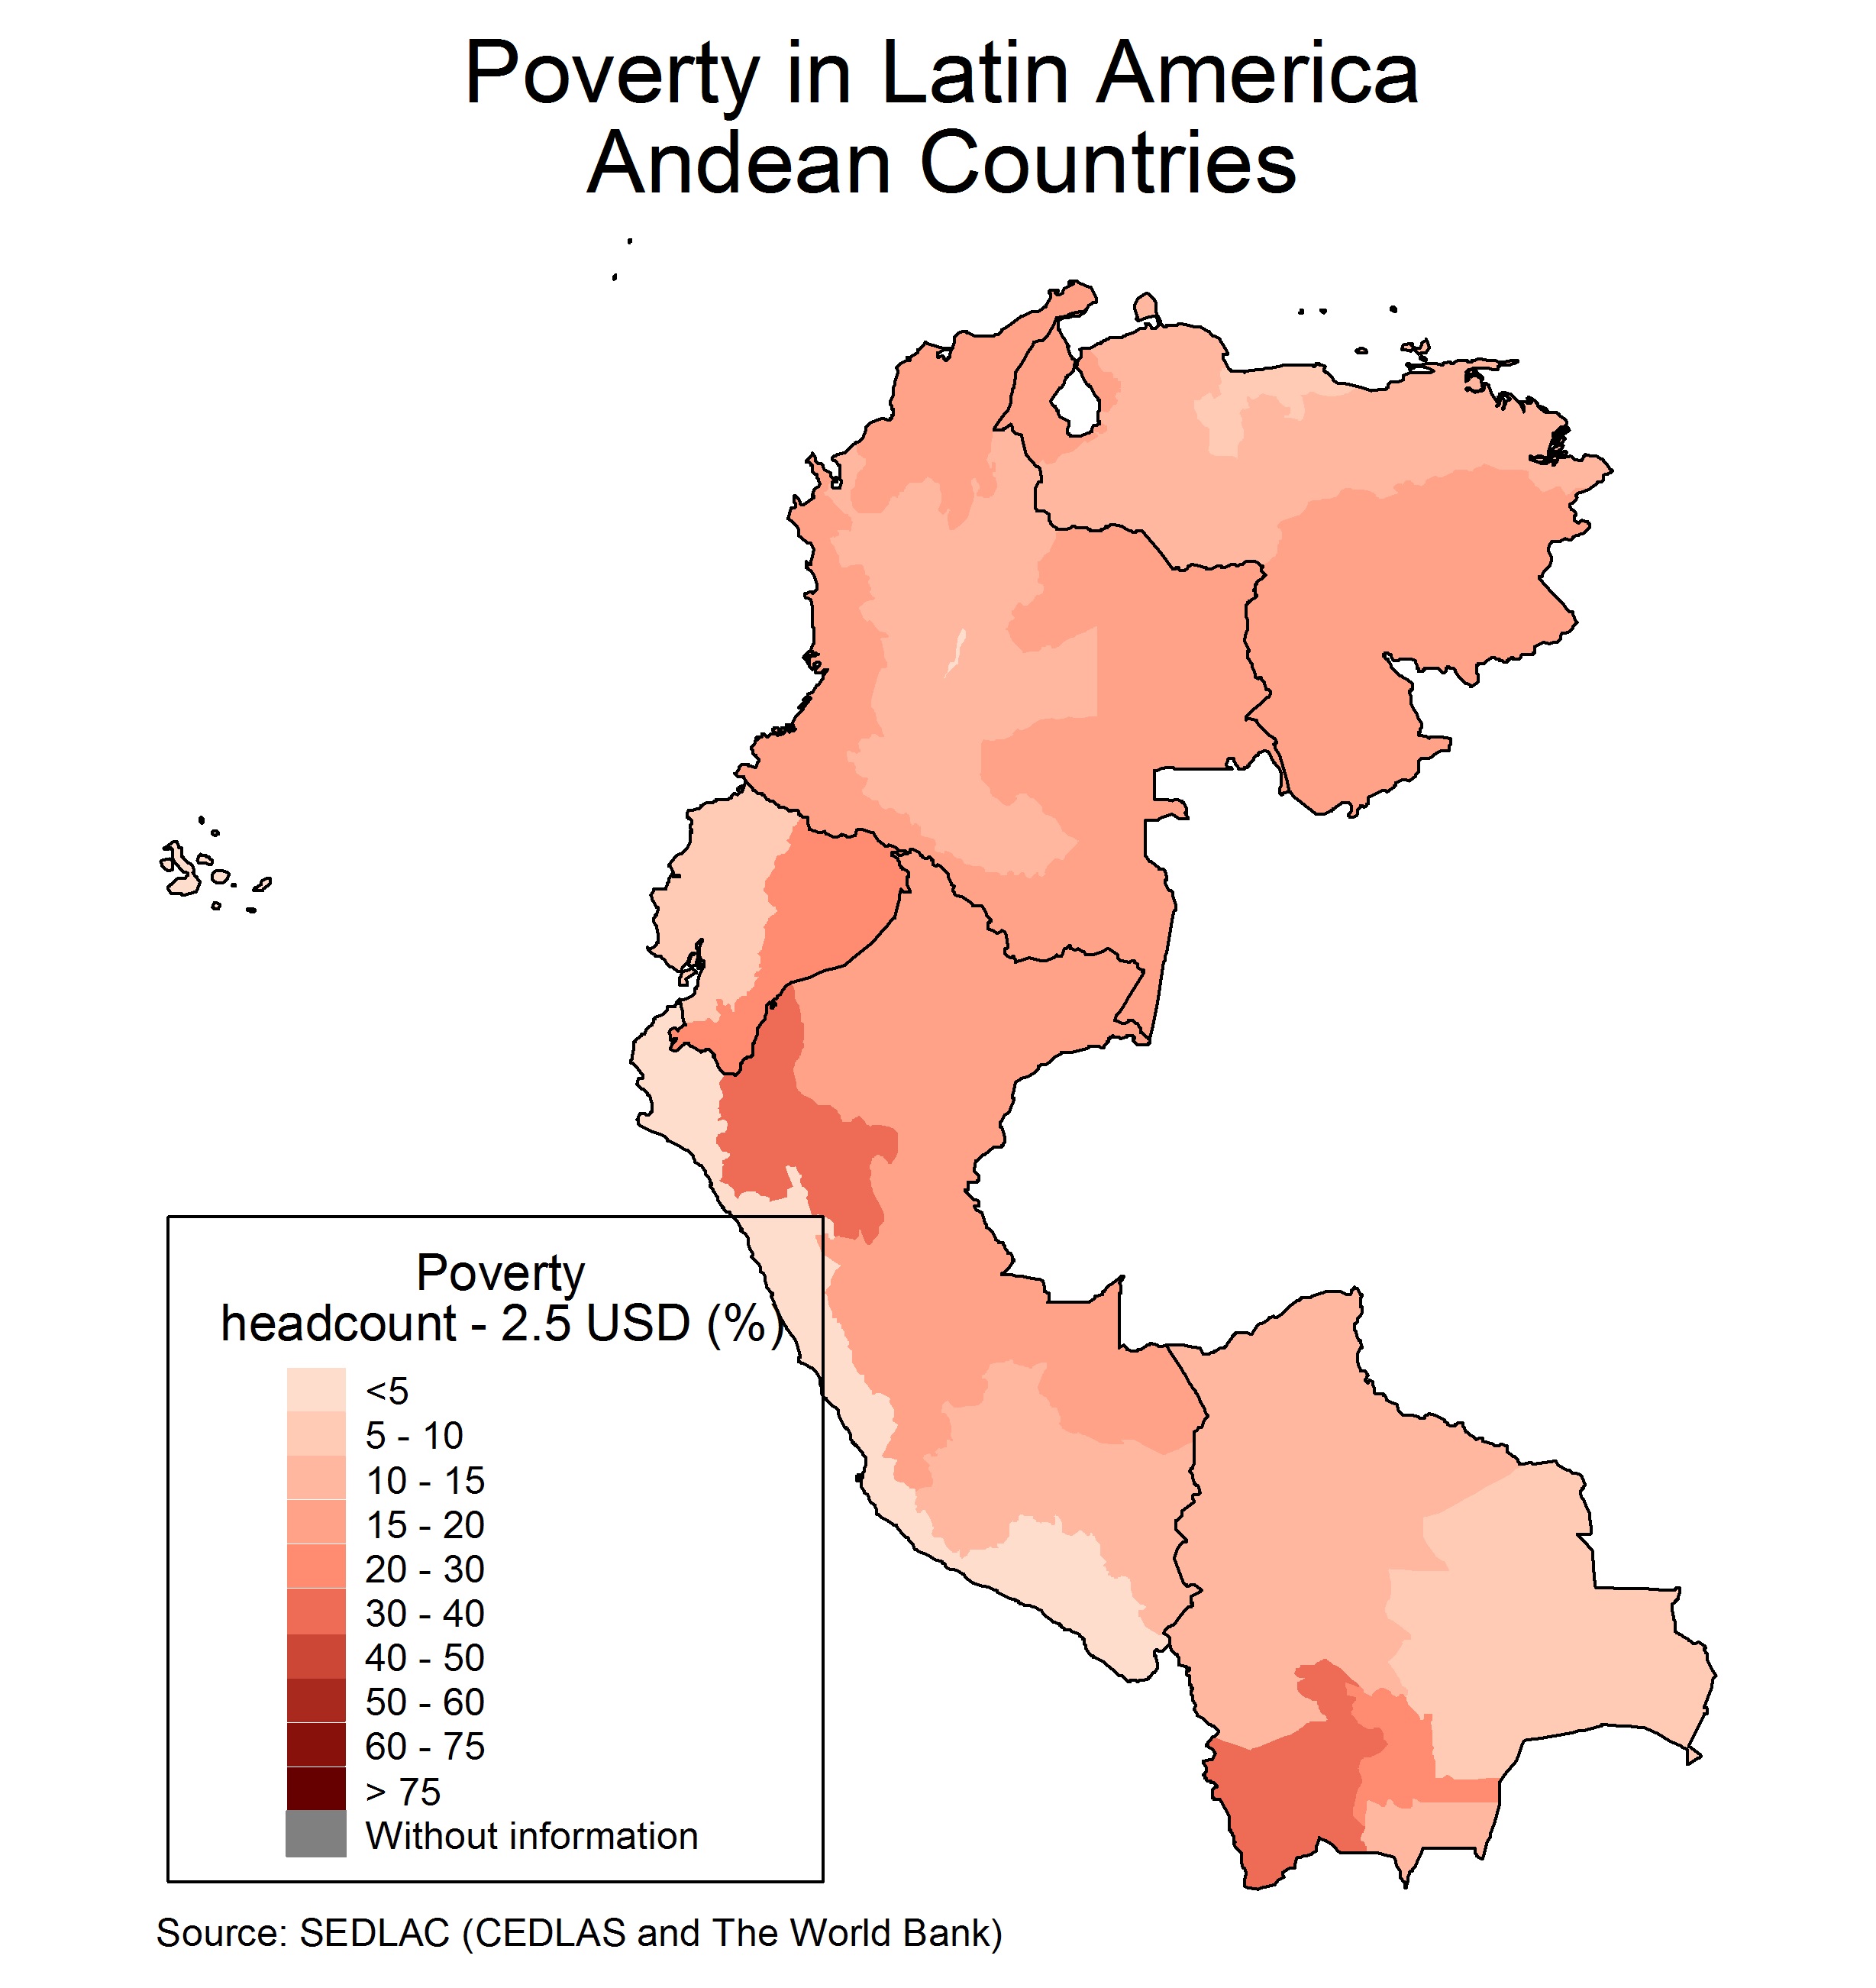
This section includes maps that illustrate the diversity in distributional and social variables in countries from Latin America and the Caribbean.

Data from SEDLAC is used by CEDLAS and World Bank’s Poverty and Equity Group to produce briefs, reports and studies.